The Hertzsprung-Russell Diagram (H-R Diagram) is a powerful tool astronomers...
Understanding the H-R Diagram
J
Josiah Reed@osiaheed_mylu3nkej4v


1 / 10
1
of 10
Understanding the H-R Diagram
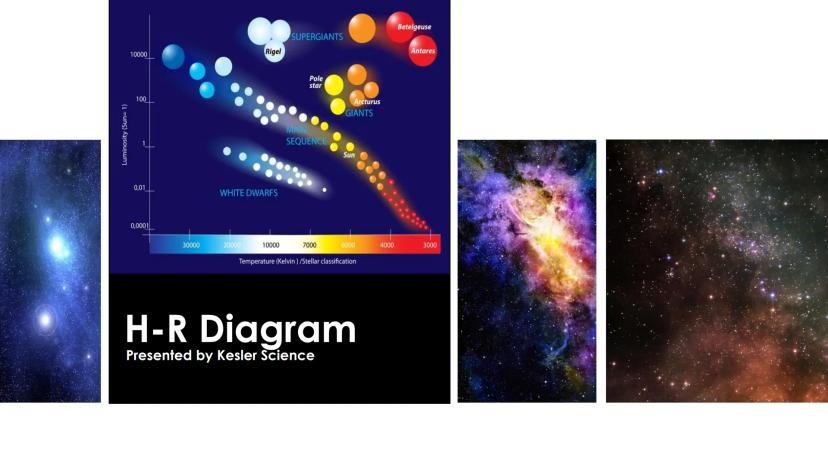
The H-R Diagram shows stars mapped according to their brightness and temperature. Stars are scattered across the diagram in specific patterns rather than randomly.
The vertical axis shows luminosity (measured relative to our Sun), while the horizontal axis shows temperature in Kelvin. Unlike typical graphs, temperature increases from right to left on an H-R Diagram.
Major groups of stars appear in distinct regions - like the diagonal band of main sequence stars where our Sun sits, and areas for giants, supergiants, and white dwarfs.
Fun Fact: Just by looking at where a star sits on the H-R Diagram, astronomers can tell its size, age, and even predict its future!
2
of 10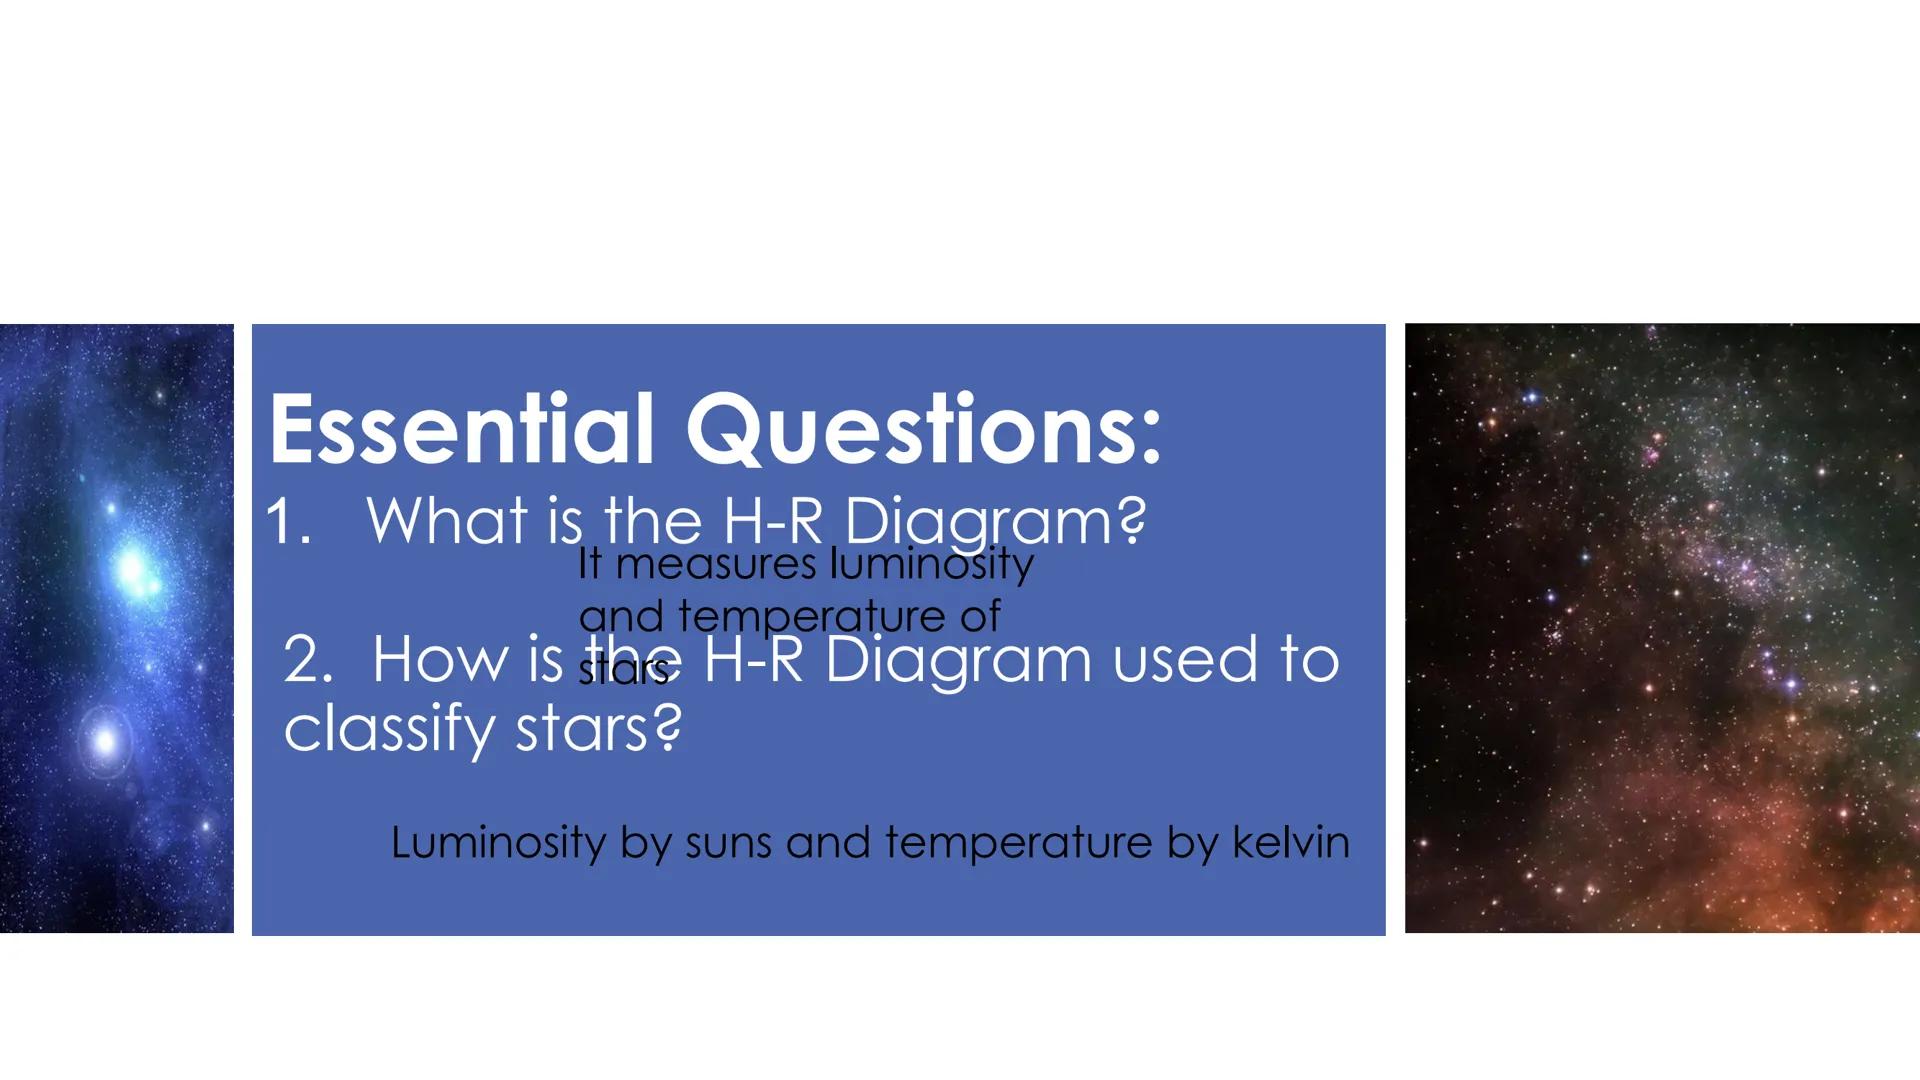
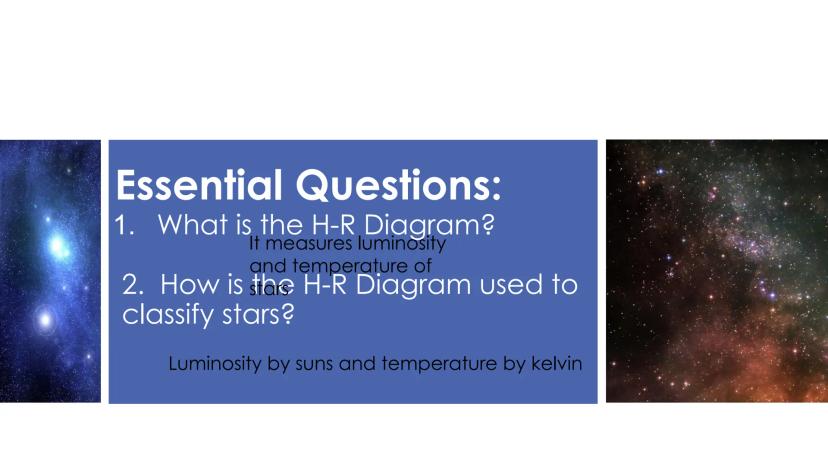
Essential Questions About the H-R Diagram
The H-R Diagram helps answer key questions about stars by organizing them visually. It measures both how bright stars are and how hot they are.
When classifying stars, astronomers use the H-R Diagram to compare luminosity (measured relative to our Sun) and temperature (measured in Kelvin). These two properties tell us a lot about a star's nature.
By seeing where a star falls on the diagram, we can immediately identify what type of star it is - whether it's a main sequence star like our Sun, a giant, a supergiant, or a dwarf star.
3
of 10
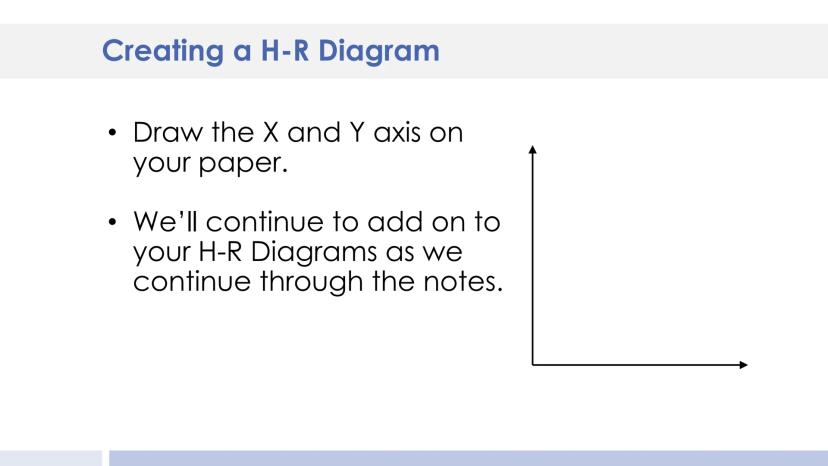
Creating Your Own H-R Diagram
Making your own H-R Diagram starts with drawing the X and Y axes on your paper. The X-axis will show temperature, and the Y-axis will show luminosity.
As you learn more about stars, you'll add different regions to your diagram. This visual representation helps you understand how stars relate to each other.
Building your diagram step by step makes it easier to understand the complex relationships between different types of stars. Think of it like creating a map of the universe's star types!
Learning Tip: Use colored pencils to mark different star types on your diagram - this makes the patterns easier to remember.
4
of 10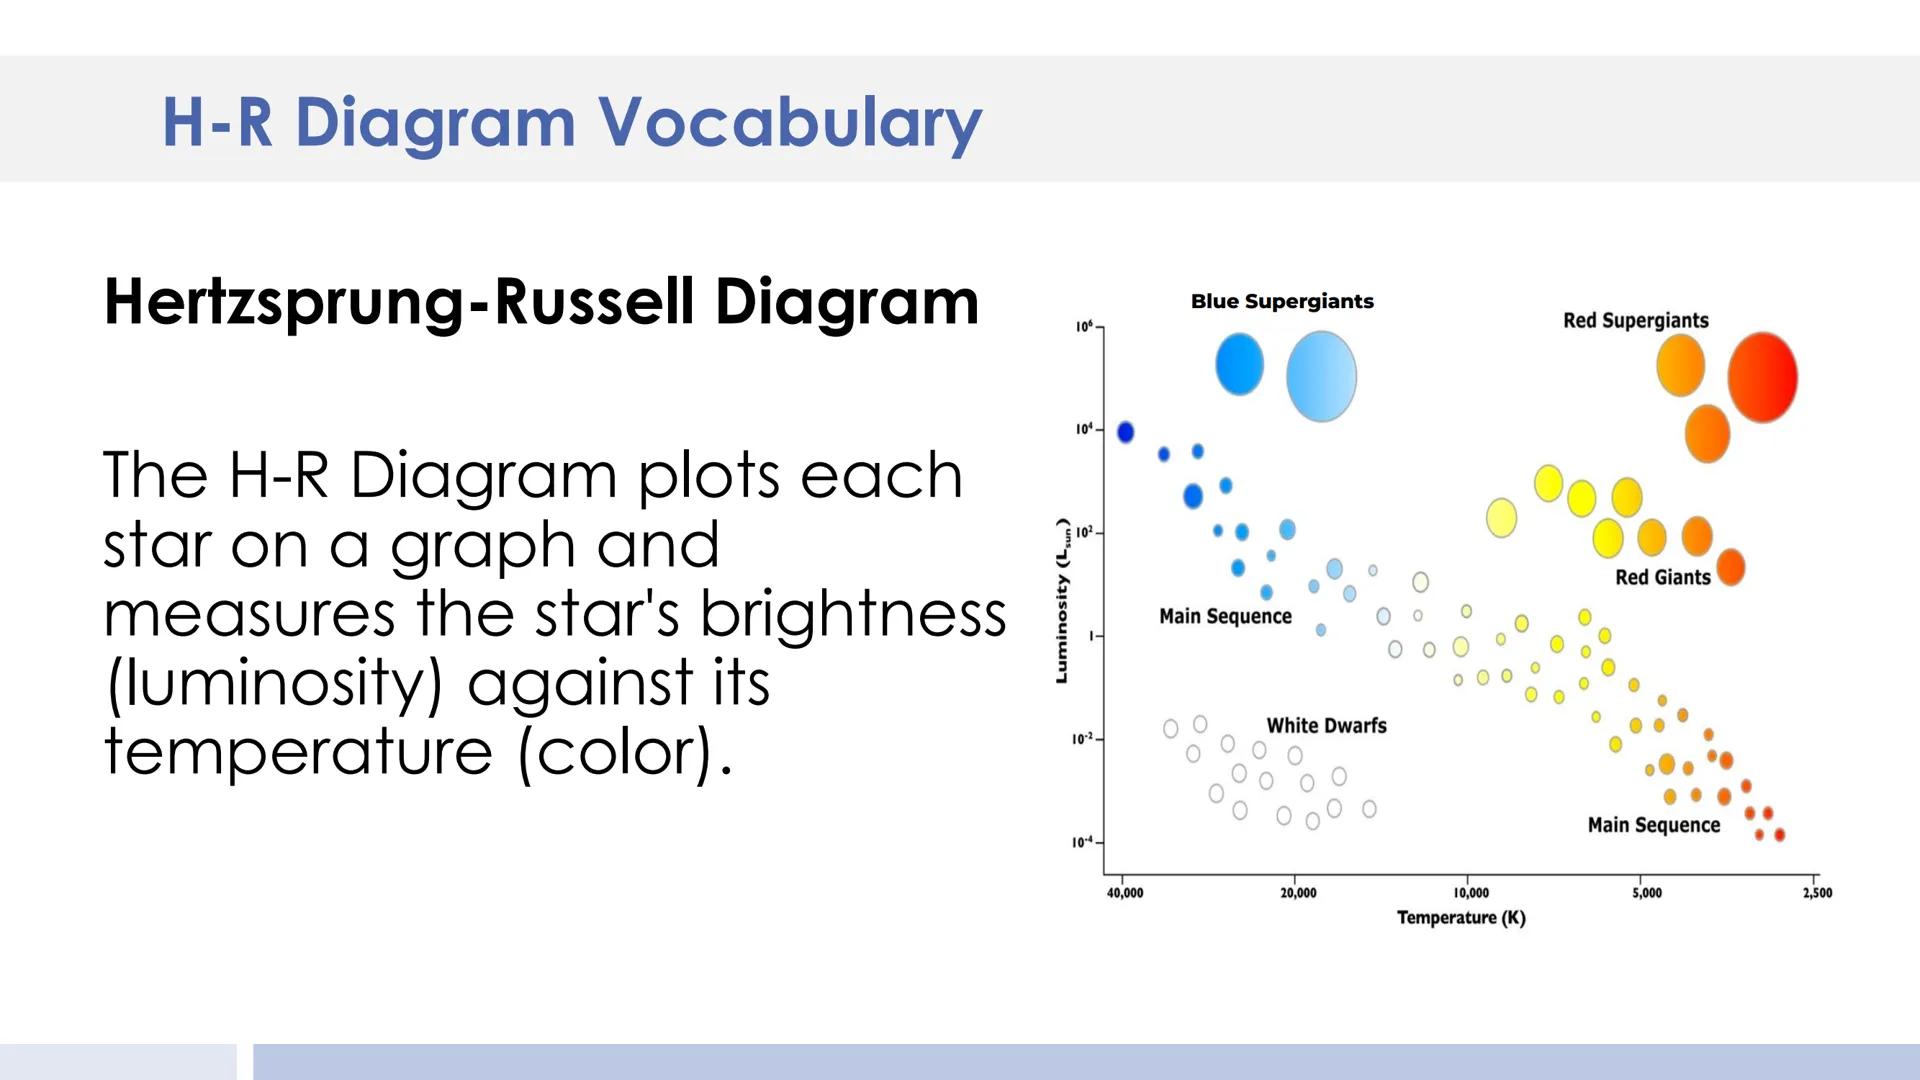
H-R Diagram Basics
The Hertzsprung-Russell Diagram plots stars by comparing their brightness (luminosity) against their temperature (which determines color). This powerful tool helps astronomers classify the billions of stars in our universe.
On an H-R Diagram, you'll notice distinct regions where different types of stars cluster. The main sequence runs diagonally across the middle, with super-bright supergiants at the top and dim white dwarfs at the bottom.
Most stars, including our Sun, fall along the main sequence. Other regions show stars at different stages of their life cycles, like red giants and white dwarfs.
5
of 10
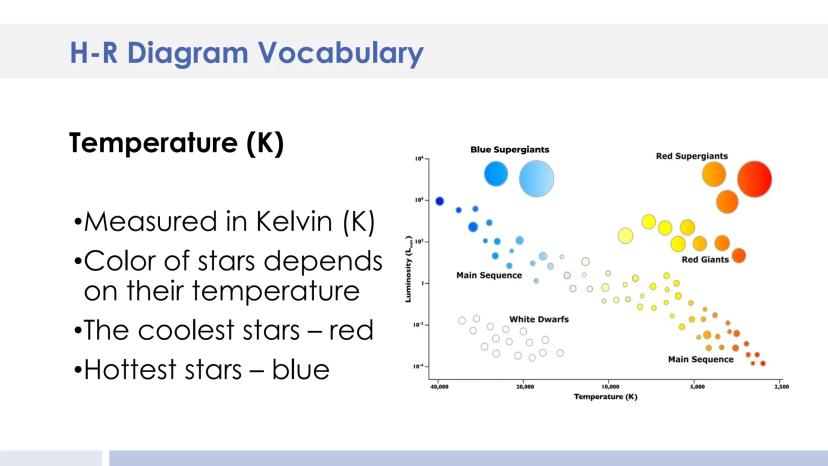
Understanding Temperature on the H-R Diagram
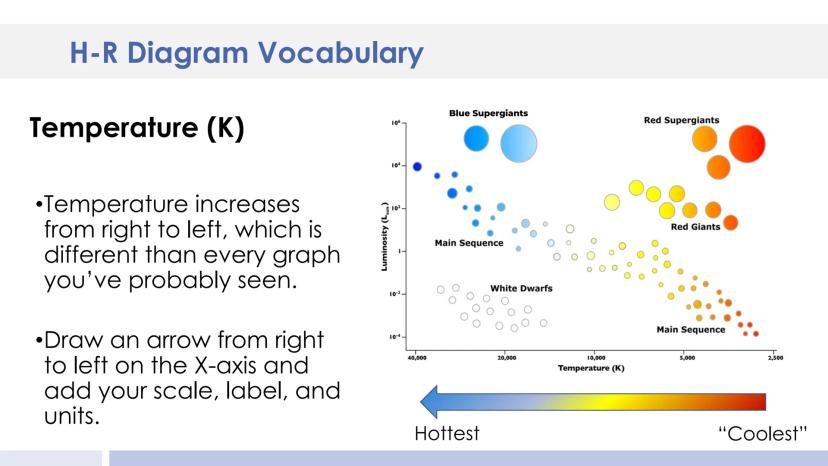
The temperature of stars is measured in Kelvin (K) and determines their color. This relationship between temperature and color gives us important clues about stars.
The coolest stars appear red (around 2,500 K), while the hottest stars glow blue (around 40,000 K). Our Sun, at about 5,500 K, appears yellow.
Looking at the diagram, you can see how temperature affects where stars appear. Red supergiants are cooler but extremely bright, while main sequence stars show a range of temperatures.
Remember: In astronomy, color directly tells us temperature - blue stars are always hotter than red stars!
6
of 10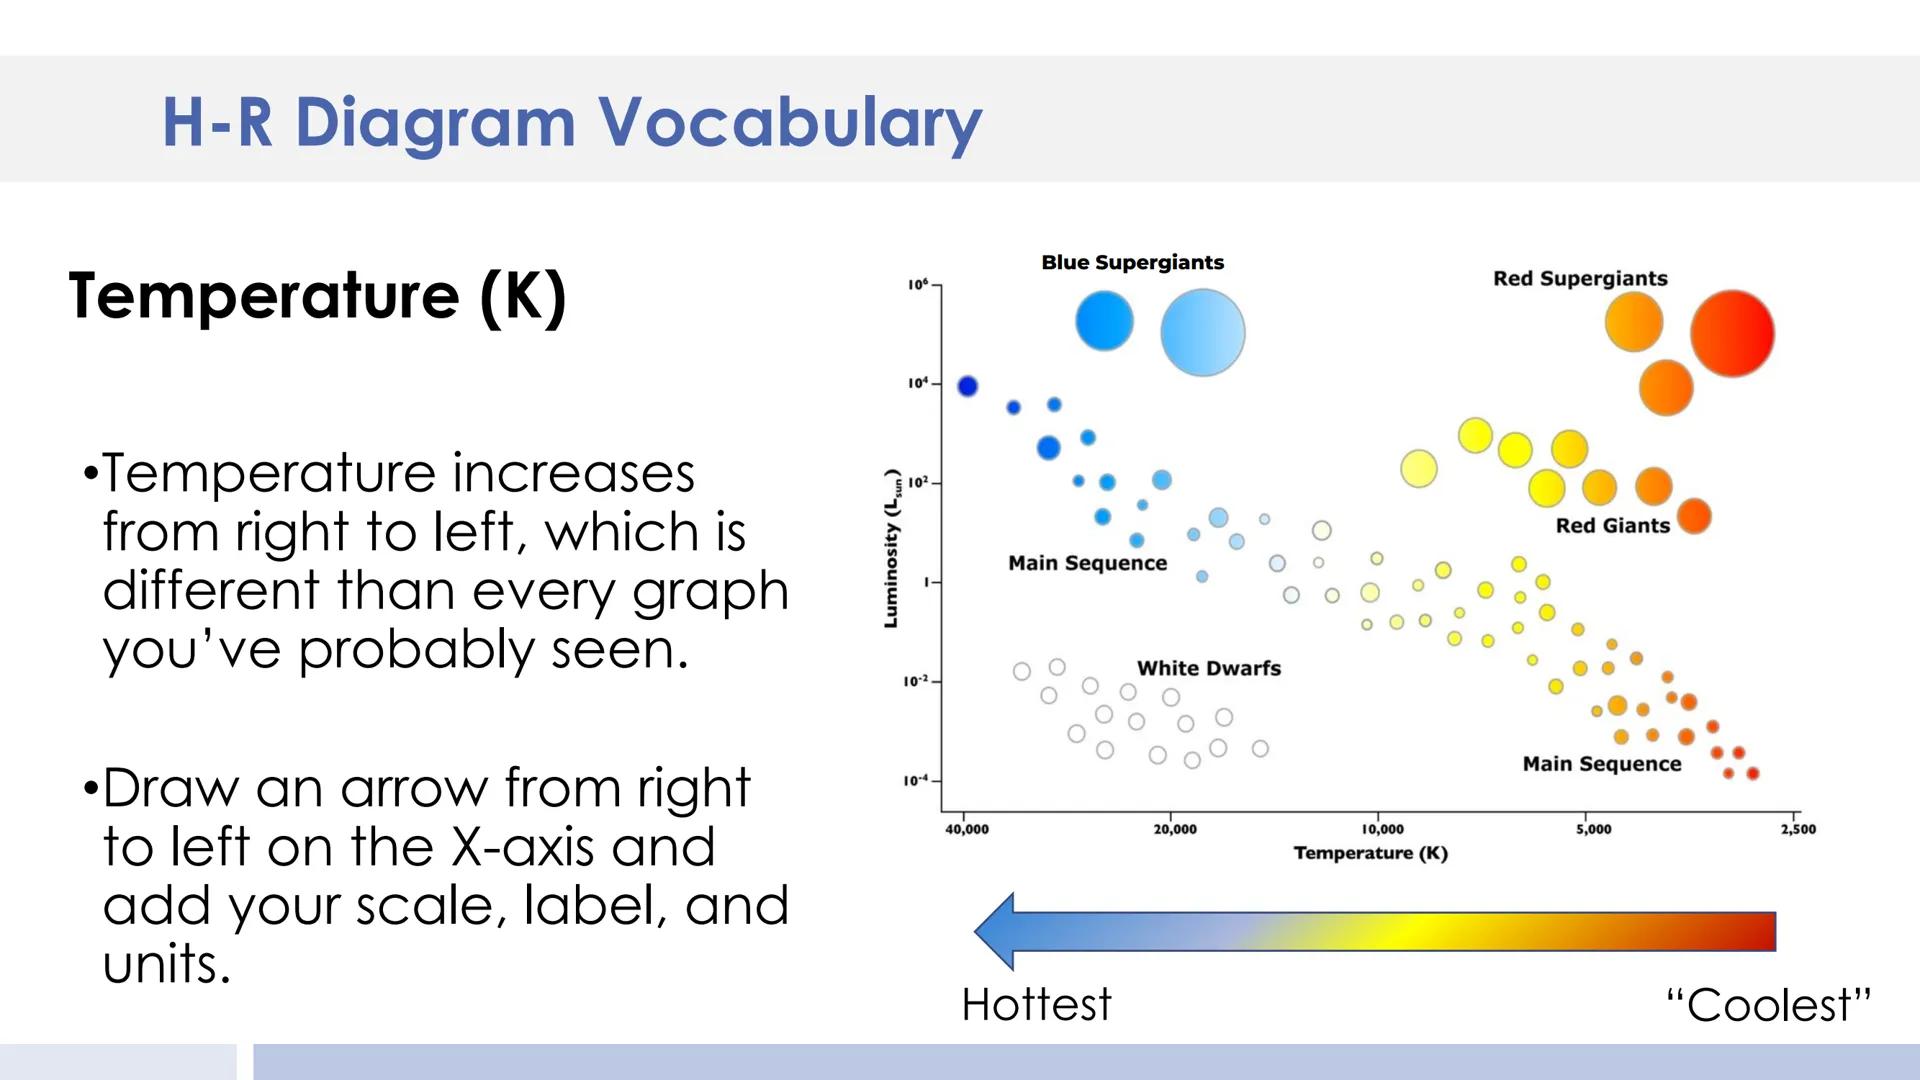
The Unusual Temperature Scale
One tricky thing about the H-R Diagram is that temperature increases from right to left on the X-axis. This is opposite from most graphs you've used before!
When adding temperature to your own H-R Diagram, draw an arrow from right to left showing that the hottest stars (around 40,000K) are on the left side, while the coolest stars (around 2,500K) are on the right.
This reversed scale takes some getting used to, but it's the standard way astronomers have organized the H-R Diagram since it was created in the early 1900s.
7
of 10
Understanding Luminosity
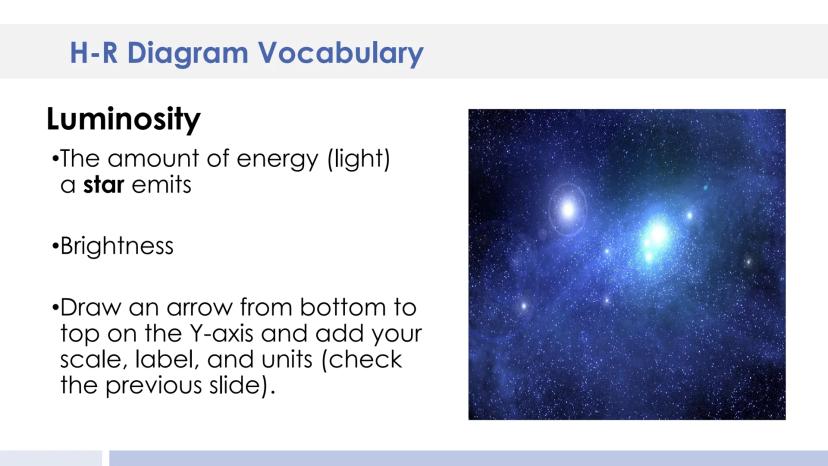
Luminosity measures the total amount of energy a star emits as light. It tells us how bright a star truly is, regardless of distance.
On the H-R Diagram, luminosity increases as you move up the Y-axis. It's typically measured relative to our Sun's brightness (Lsun), with values ranging from 10^-4 (much dimmer than the Sun) to 10^6 (a million times brighter).
When creating your own diagram, draw an arrow pointing upward on the Y-axis to show increasing luminosity. This scale helps us compare stars of vastly different brightness levels.
Perspective Check: Some supergiants are over 100,000 times brighter than our Sun - imagine how our night sky would look if we orbited one of those!
8
of 10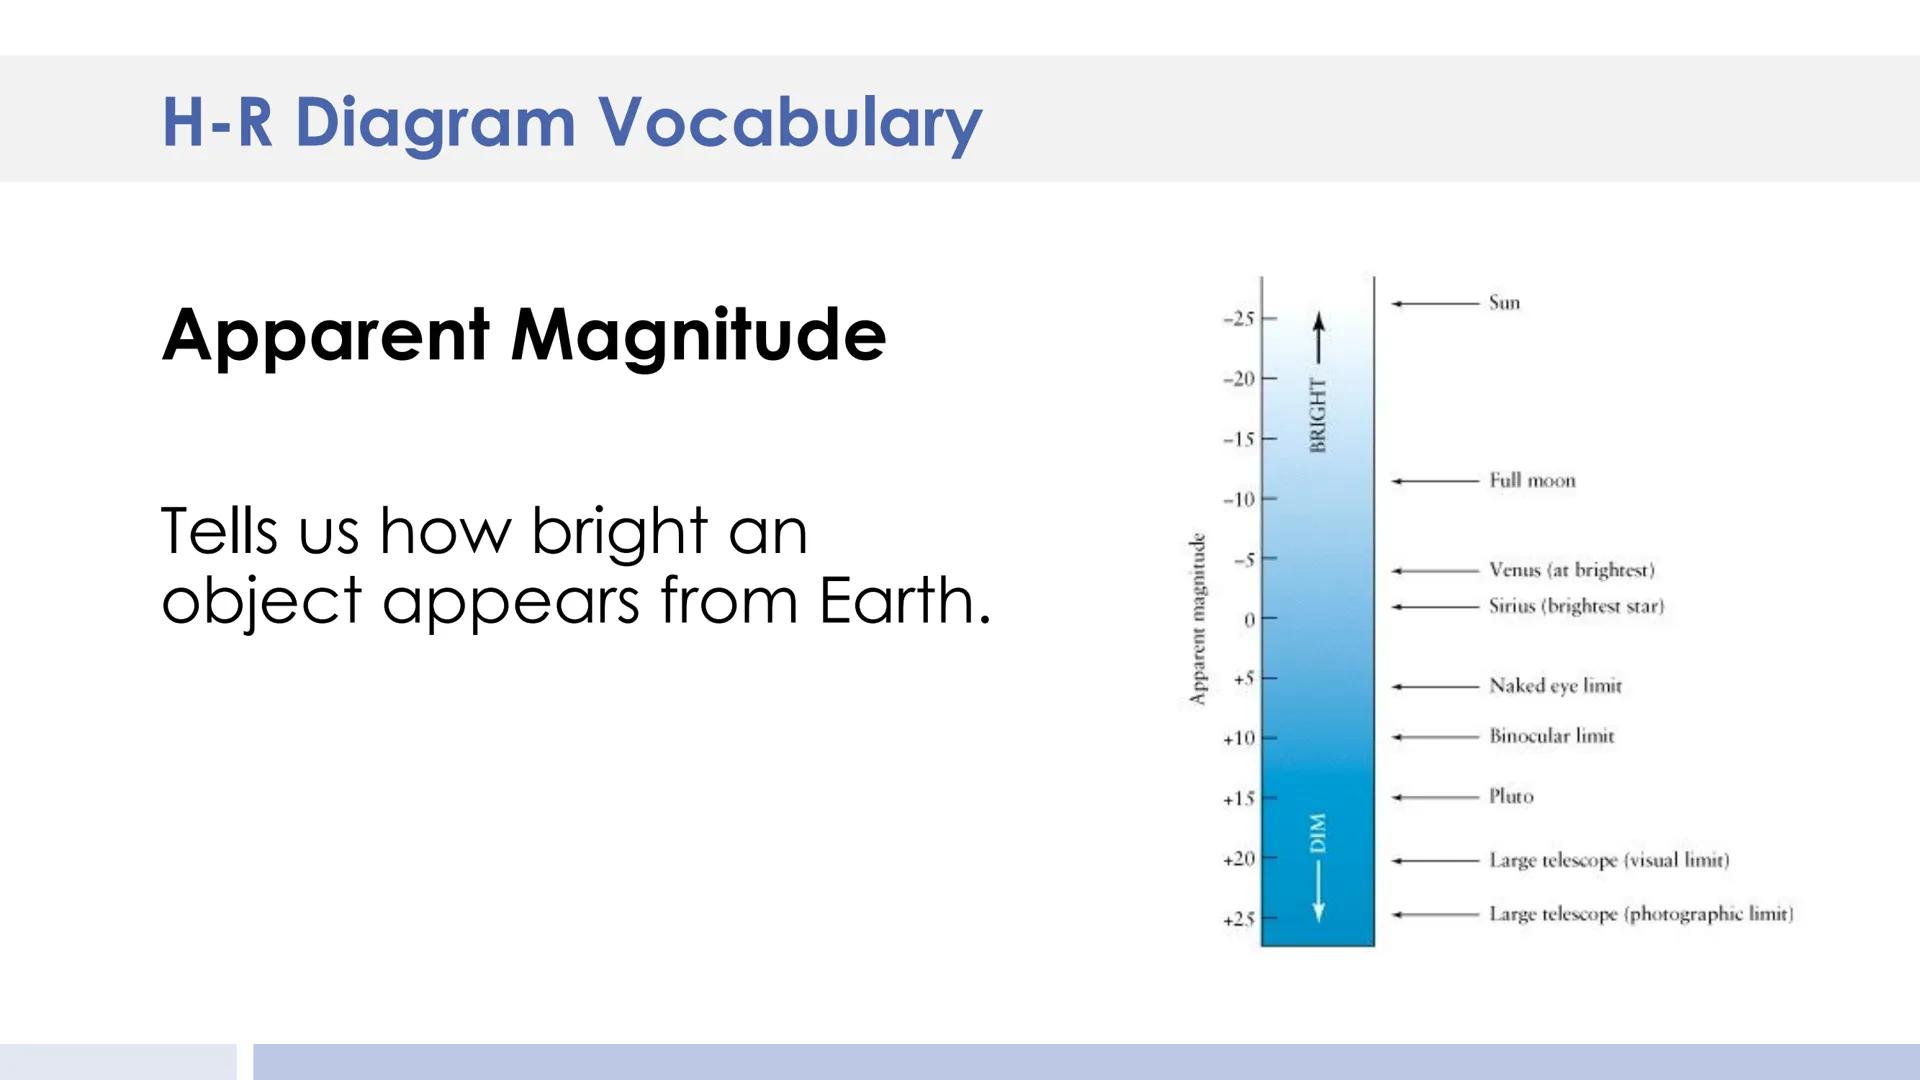
Apparent Magnitude: How Bright Stars Look
Apparent magnitude measures how bright a star looks from Earth, regardless of its actual luminosity. This scale ranges from negative numbers (very bright) to positive numbers (very dim).
The brightest objects have the lowest values—the Sun has an apparent magnitude of -25, while the dimmest stars visible to the naked eye have a magnitude of about +6.
With binoculars, you can see stars to about +10 magnitude, while large telescopes can detect objects all the way to +25 magnitude. This scale helps astronomers describe what we can actually see when we look up.
9
of 10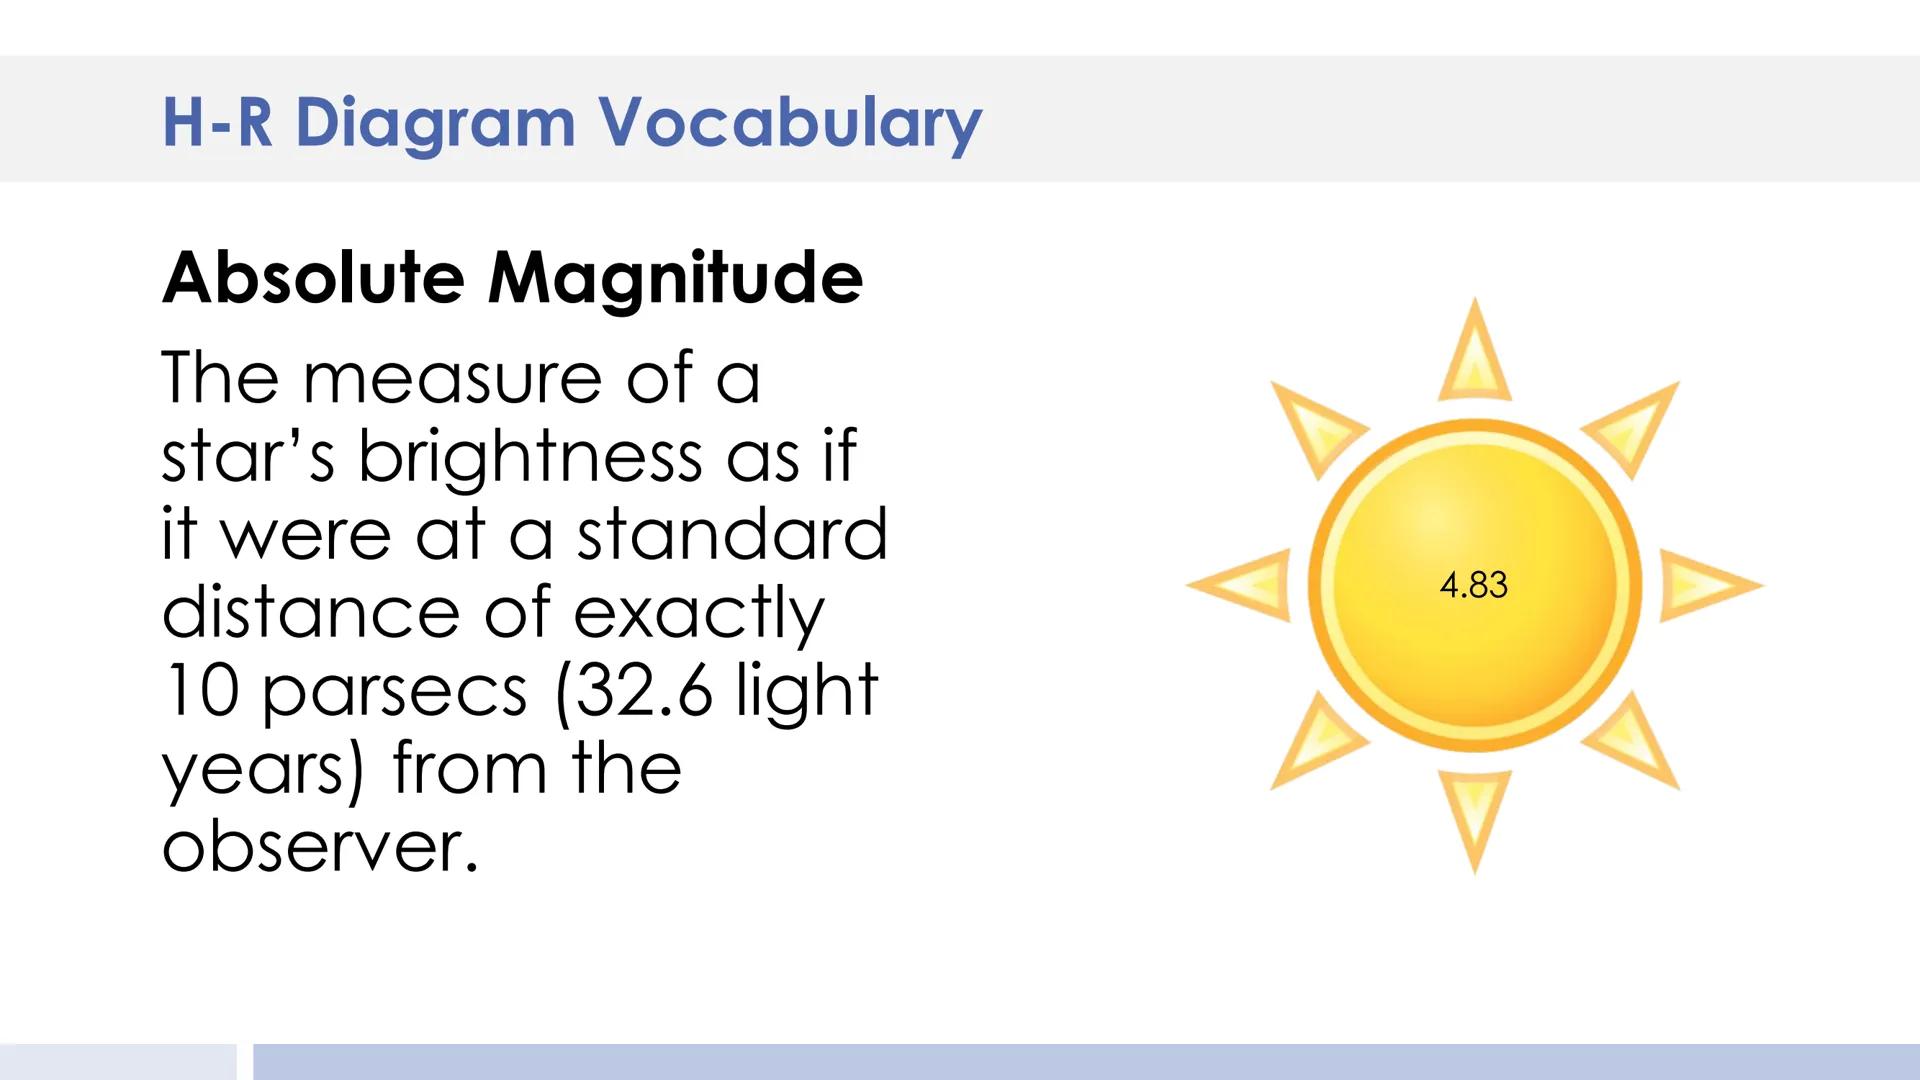
Absolute Magnitude: True Brightness
Absolute magnitude tells us how bright a star would appear if it were placed at a standard distance of exactly 32.6 light years from Earth. This allows for fair brightness comparisons between stars.
Unlike apparent magnitude (how bright a star looks from Earth), absolute magnitude eliminates the distance factor. Our Sun has an absolute magnitude of 4.83.
This standardized measurement helps astronomers compare the true brightness of stars without being fooled by how close or far away they are from us.
Cool Connection: A star might look bright in our sky simply because it's close, but its absolute magnitude reveals its true brightness compared to other stars.
10
of 10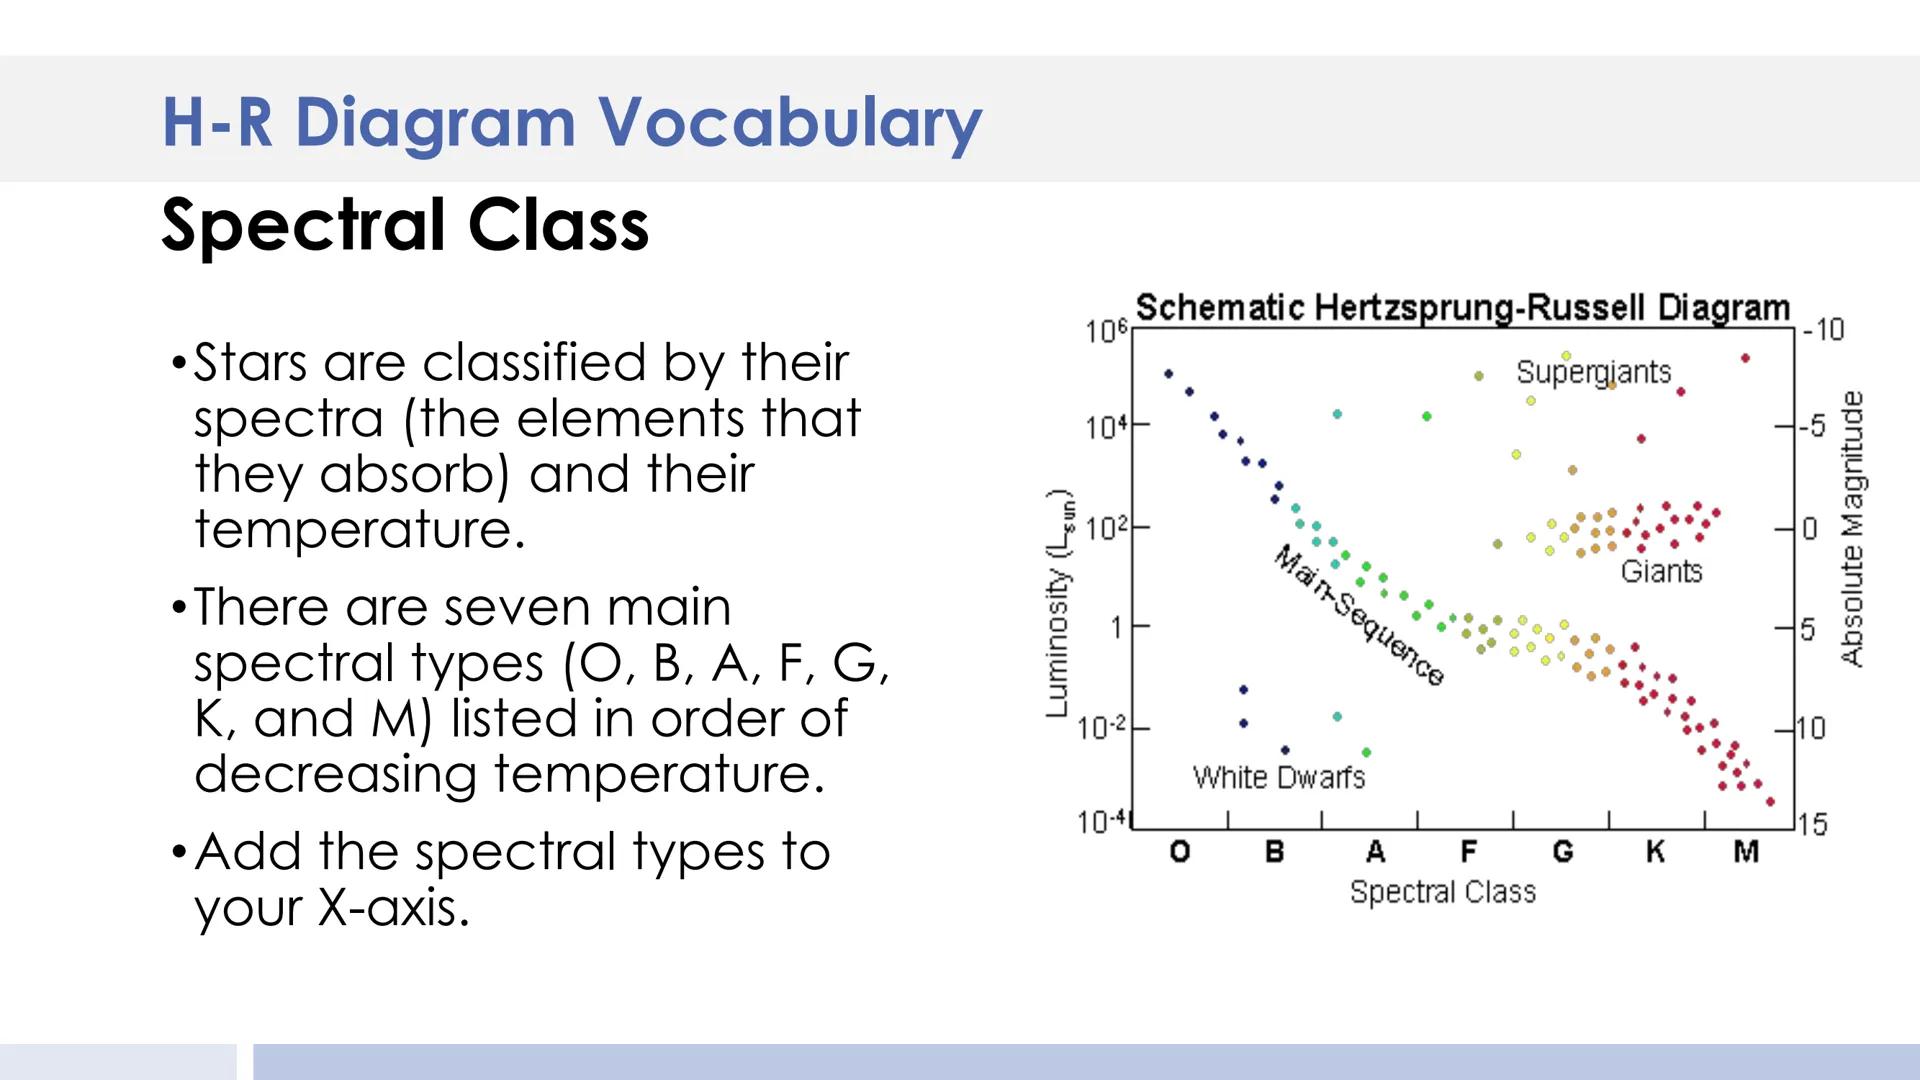
Spectral Classes of Stars
Stars are classified into seven main spectral types: O, B, A, F, G, K, and M. This classification is based on the elements they absorb and their temperature.
The hottest stars are type O (blue), while the coolest are type M (red). Our Sun is a type G (yellow) star. An easy way to remember the order is the phrase "Oh Be A Fine Girl/Guy, Kiss Me."
When adding spectral types to your H-R Diagram, place them along the X-axis with O-type stars on the left (hottest) and M-type stars on the right (coolest). This classification helps astronomers communicate about star types using a standard system.
We thought you’d never ask...
Our AI companion is specifically built for the needs of students. Based on the millions of content pieces we have on the platform we can provide truly meaningful and relevant answers to students. But its not only about answers, the companion is even more about guiding students through their daily learning challenges, with personalised study plans, quizzes or content pieces in the chat and 100% personalisation based on the students skills and developments.
You can download the app in the Google Play Store and in the Apple App Store.
That's right! Enjoy free access to study content, connect with fellow students, and get instant help – all at your fingertips.
Similar Content
Most popular content: Key Concepts
3Balanced And Unbalanced Forces
Balanced forces do not cause any change in the state of motion of a body. Unbalanced forces accelerate the body.
470
Conduction,Convection, and radiation
Conduction, Convection, and radiation
8th471
Electromagnetic spectrum
Electromagnetic spectrum
College1002
Most popular content in Science (ACT®)
9DNA & Protein Synthesis: Replication, Transcription, & Translation
A concise overview of DNA replication and protein synthesis. Learn about the central dogma and the steps of transcription and translation that create proteins from genetic code.
9th4529
Cell Theory & Types: History and Prokaryotic vs. Eukaryotic Cells
Learn about the scientists behind the cell theory history. Review the key structural differences defining prokaryotic versus eukaryotic cells.
9th2892
I
Introduction to Biomolecule Types
Identify the four main types of biomolecules and their corresponding monomers: carbohydrates, lipids, proteins, and nucleic acids.
9th1680
S
Structure and Function of Biomolecules
Examine the chemical structures and biological roles of biomolecules in cellular processes and energy storage.
9th1240
BIOGEOCHEMICAL CYCLES
Gives an overview about chemical elements and movement of elements.
1348
Type of matter
These study notes will help you explain the type of matter such as solid, liquid, and gas, there are other definitions or terms that are part of the matter too.
402
Seasons
Seasons
College390
Balanced And Unbalanced Forces
Balanced forces do not cause any change in the state of motion of a body. Unbalanced forces accelerate the body.
470
Scientific Process
Variables, Independent, Example, Dependent, Controlled
20512
Most popular content
9O
Origins and Dynamics of the Columbian Exchange
Analyze the ecological and economic motivations behind the initial transfer of goods, people, and diseases between the Old and New Worlds.
9th3,1280
I
Introduction to Early Cultural Interactions
Analyze the initial social and religious encounters between Europeans, Africans, and Indigenous peoples in the colonial Americas.
9th2,7730
O
Origins of Ancient River Civilizations
Analyze the environmental factors and technological innovations that led to the rise of early states in Mesopotamia, Egypt, and the Indus Valley.
9th3,1870
M
Motivations for European Exploration
Analyze the economic, religious, and political factors that drove European powers to the Americas during the 15th and 16th centuries.
9th1,7780
F
Foundations of Ethical Guidelines in Research
Practice the core principles of the APA ethical code including informed consent, debriefing, and the role of Institutional Review Boards.
9th1,3360
I
Introduction to Native American Societies
Examine the diverse social, political, and economic structures of North American indigenous groups prior to European contact.
9th1,1100
I
Introduction to the Spanish Encomienda System
Explore the fundamental economic and social structures of the Spanish colonial system, focusing on the encomienda and the casta social hierarchy.
9th8890
I
Introduction to Biological Elements of Life
Practice identifying the essential elements including carbon, nitrogen, phosphorus, and sulfur that compose biological macromolecules.
9th1,7410
O
Origins of the Articles of Confederation
Practice identifying the motivations for a weak central government and the specific powers granted to the states under the first U.S. constitution.
9th9370
Students love us — and so will you.
4.6/5App Store
4.7/5Google Play
The app is very easy to use and well designed. I have found everything I was looking for so far and have been able to learn a lot from the presentations! I will definitely use the app for a class assignment! And of course it also helps a lot as an inspiration.
Stefan SiOS user
This app is really great. There are so many study notes and help [...]. My problem subject is French, for example, and the app has so many options for help. Thanks to this app, I have improved my French. I would recommend it to anyone.
Samantha KlichAndroid user
Wow, I am really amazed. I just tried the app because I've seen it advertised many times and was absolutely stunned. This app is THE HELP you want for school and above all, it offers so many things, such as workouts and fact sheets, which have been VERY helpful to me personally.
AnnaiOS user
Understanding the H-R Diagram
J
Josiah Reed@osiaheed_mylu3nkej4v
The Hertzsprung-Russell Diagram (H-R Diagram) is a powerful tool astronomers use to classify and understand stars. It plots stars based on their brightness (luminosity) and temperature, helping us see relationships between different types of stars and understand their life cycles.
1
of 10
Sign up to see the content. It's free!
- Access to all documents
- Improve your grades
- Join milions of students
Understanding the H-R Diagram
The H-R Diagram shows stars mapped according to their brightness and temperature. Stars are scattered across the diagram in specific patterns rather than randomly.
The vertical axis shows luminosity (measured relative to our Sun), while the horizontal axis shows temperature in Kelvin. Unlike typical graphs, temperature increases from right to left on an H-R Diagram.
Major groups of stars appear in distinct regions - like the diagonal band of main sequence stars where our Sun sits, and areas for giants, supergiants, and white dwarfs.
Fun Fact: Just by looking at where a star sits on the H-R Diagram, astronomers can tell its size, age, and even predict its future!
2
of 10Sign up to see the content. It's free!
- Access to all documents
- Improve your grades
- Join milions of students
Essential Questions About the H-R Diagram
The H-R Diagram helps answer key questions about stars by organizing them visually. It measures both how bright stars are and how hot they are.
When classifying stars, astronomers use the H-R Diagram to compare luminosity (measured relative to our Sun) and temperature (measured in Kelvin). These two properties tell us a lot about a star's nature.
By seeing where a star falls on the diagram, we can immediately identify what type of star it is - whether it's a main sequence star like our Sun, a giant, a supergiant, or a dwarf star.
3
of 10Sign up to see the content. It's free!
- Access to all documents
- Improve your grades
- Join milions of students
Creating Your Own H-R Diagram
Making your own H-R Diagram starts with drawing the X and Y axes on your paper. The X-axis will show temperature, and the Y-axis will show luminosity.
As you learn more about stars, you'll add different regions to your diagram. This visual representation helps you understand how stars relate to each other.
Building your diagram step by step makes it easier to understand the complex relationships between different types of stars. Think of it like creating a map of the universe's star types!
Learning Tip: Use colored pencils to mark different star types on your diagram - this makes the patterns easier to remember.
4
of 10Sign up to see the content. It's free!
- Access to all documents
- Improve your grades
- Join milions of students
H-R Diagram Basics
The Hertzsprung-Russell Diagram plots stars by comparing their brightness (luminosity) against their temperature (which determines color). This powerful tool helps astronomers classify the billions of stars in our universe.
On an H-R Diagram, you'll notice distinct regions where different types of stars cluster. The main sequence runs diagonally across the middle, with super-bright supergiants at the top and dim white dwarfs at the bottom.
Most stars, including our Sun, fall along the main sequence. Other regions show stars at different stages of their life cycles, like red giants and white dwarfs.
5
of 10Sign up to see the content. It's free!
- Access to all documents
- Improve your grades
- Join milions of students
Understanding Temperature on the H-R Diagram
The temperature of stars is measured in Kelvin (K) and determines their color. This relationship between temperature and color gives us important clues about stars.
The coolest stars appear red (around 2,500 K), while the hottest stars glow blue (around 40,000 K). Our Sun, at about 5,500 K, appears yellow.
Looking at the diagram, you can see how temperature affects where stars appear. Red supergiants are cooler but extremely bright, while main sequence stars show a range of temperatures.
Remember: In astronomy, color directly tells us temperature - blue stars are always hotter than red stars!
6
of 10Sign up to see the content. It's free!
- Access to all documents
- Improve your grades
- Join milions of students
The Unusual Temperature Scale
One tricky thing about the H-R Diagram is that temperature increases from right to left on the X-axis. This is opposite from most graphs you've used before!
When adding temperature to your own H-R Diagram, draw an arrow from right to left showing that the hottest stars (around 40,000K) are on the left side, while the coolest stars (around 2,500K) are on the right.
This reversed scale takes some getting used to, but it's the standard way astronomers have organized the H-R Diagram since it was created in the early 1900s.
7
of 10Sign up to see the content. It's free!
- Access to all documents
- Improve your grades
- Join milions of students
Understanding Luminosity
Luminosity measures the total amount of energy a star emits as light. It tells us how bright a star truly is, regardless of distance.
On the H-R Diagram, luminosity increases as you move up the Y-axis. It's typically measured relative to our Sun's brightness (Lsun), with values ranging from 10^-4 (much dimmer than the Sun) to 10^6 (a million times brighter).
When creating your own diagram, draw an arrow pointing upward on the Y-axis to show increasing luminosity. This scale helps us compare stars of vastly different brightness levels.
Perspective Check: Some supergiants are over 100,000 times brighter than our Sun - imagine how our night sky would look if we orbited one of those!
8
of 10Sign up to see the content. It's free!
- Access to all documents
- Improve your grades
- Join milions of students
Apparent Magnitude: How Bright Stars Look
Apparent magnitude measures how bright a star looks from Earth, regardless of its actual luminosity. This scale ranges from negative numbers (very bright) to positive numbers (very dim).
The brightest objects have the lowest values—the Sun has an apparent magnitude of -25, while the dimmest stars visible to the naked eye have a magnitude of about +6.
With binoculars, you can see stars to about +10 magnitude, while large telescopes can detect objects all the way to +25 magnitude. This scale helps astronomers describe what we can actually see when we look up.
9
of 10Sign up to see the content. It's free!
- Access to all documents
- Improve your grades
- Join milions of students
Absolute Magnitude: True Brightness
Absolute magnitude tells us how bright a star would appear if it were placed at a standard distance of exactly 32.6 light years from Earth. This allows for fair brightness comparisons between stars.
Unlike apparent magnitude (how bright a star looks from Earth), absolute magnitude eliminates the distance factor. Our Sun has an absolute magnitude of 4.83.
This standardized measurement helps astronomers compare the true brightness of stars without being fooled by how close or far away they are from us.
Cool Connection: A star might look bright in our sky simply because it's close, but its absolute magnitude reveals its true brightness compared to other stars.
10
of 10Sign up to see the content. It's free!
- Access to all documents
- Improve your grades
- Join milions of students
Spectral Classes of Stars
Stars are classified into seven main spectral types: O, B, A, F, G, K, and M. This classification is based on the elements they absorb and their temperature.
The hottest stars are type O (blue), while the coolest are type M (red). Our Sun is a type G (yellow) star. An easy way to remember the order is the phrase "Oh Be A Fine Girl/Guy, Kiss Me."
When adding spectral types to your H-R Diagram, place them along the X-axis with O-type stars on the left (hottest) and M-type stars on the right (coolest). This classification helps astronomers communicate about star types using a standard system.
We thought you’d never ask...
Our AI companion is specifically built for the needs of students. Based on the millions of content pieces we have on the platform we can provide truly meaningful and relevant answers to students. But its not only about answers, the companion is even more about guiding students through their daily learning challenges, with personalised study plans, quizzes or content pieces in the chat and 100% personalisation based on the students skills and developments.
You can download the app in the Google Play Store and in the Apple App Store.
That's right! Enjoy free access to study content, connect with fellow students, and get instant help – all at your fingertips.
Similar Content
Most popular content: Key Concepts
3Balanced And Unbalanced Forces
Balanced forces do not cause any change in the state of motion of a body. Unbalanced forces accelerate the body.
470
Conduction,Convection, and radiation
Conduction, Convection, and radiation
8th471
Electromagnetic spectrum
Electromagnetic spectrum
College1002
Most popular content in Science (ACT®)
9DNA & Protein Synthesis: Replication, Transcription, & Translation
A concise overview of DNA replication and protein synthesis. Learn about the central dogma and the steps of transcription and translation that create proteins from genetic code.
9th4529
Cell Theory & Types: History and Prokaryotic vs. Eukaryotic Cells
Learn about the scientists behind the cell theory history. Review the key structural differences defining prokaryotic versus eukaryotic cells.
9th2892
I
Introduction to Biomolecule Types
Identify the four main types of biomolecules and their corresponding monomers: carbohydrates, lipids, proteins, and nucleic acids.
9th1680
S
Structure and Function of Biomolecules
Examine the chemical structures and biological roles of biomolecules in cellular processes and energy storage.
9th1240
BIOGEOCHEMICAL CYCLES
Gives an overview about chemical elements and movement of elements.
1348
Type of matter
These study notes will help you explain the type of matter such as solid, liquid, and gas, there are other definitions or terms that are part of the matter too.
402
Seasons
Seasons
College390
Balanced And Unbalanced Forces
Balanced forces do not cause any change in the state of motion of a body. Unbalanced forces accelerate the body.
470
Scientific Process
Variables, Independent, Example, Dependent, Controlled
20512
Most popular content
9O
Origins and Dynamics of the Columbian Exchange
Analyze the ecological and economic motivations behind the initial transfer of goods, people, and diseases between the Old and New Worlds.
9th3,1280
I
Introduction to Early Cultural Interactions
Analyze the initial social and religious encounters between Europeans, Africans, and Indigenous peoples in the colonial Americas.
9th2,7730
O
Origins of Ancient River Civilizations
Analyze the environmental factors and technological innovations that led to the rise of early states in Mesopotamia, Egypt, and the Indus Valley.
9th3,1870
M
Motivations for European Exploration
Analyze the economic, religious, and political factors that drove European powers to the Americas during the 15th and 16th centuries.
9th1,7780
F
Foundations of Ethical Guidelines in Research
Practice the core principles of the APA ethical code including informed consent, debriefing, and the role of Institutional Review Boards.
9th1,3360
I
Introduction to Native American Societies
Examine the diverse social, political, and economic structures of North American indigenous groups prior to European contact.
9th1,1100
I
Introduction to the Spanish Encomienda System
Explore the fundamental economic and social structures of the Spanish colonial system, focusing on the encomienda and the casta social hierarchy.
9th8890
I
Introduction to Biological Elements of Life
Practice identifying the essential elements including carbon, nitrogen, phosphorus, and sulfur that compose biological macromolecules.
9th1,7410
O
Origins of the Articles of Confederation
Practice identifying the motivations for a weak central government and the specific powers granted to the states under the first U.S. constitution.
9th9370
Students love us — and so will you.
4.6/5App Store
4.7/5Google Play
The app is very easy to use and well designed. I have found everything I was looking for so far and have been able to learn a lot from the presentations! I will definitely use the app for a class assignment! And of course it also helps a lot as an inspiration.
Stefan SiOS user
This app is really great. There are so many study notes and help [...]. My problem subject is French, for example, and the app has so many options for help. Thanks to this app, I have improved my French. I would recommend it to anyone.
Samantha KlichAndroid user
Wow, I am really amazed. I just tried the app because I've seen it advertised many times and was absolutely stunned. This app is THE HELP you want for school and above all, it offers so many things, such as workouts and fact sheets, which have been VERY helpful to me personally.
AnnaiOS user