
Statistical inference is your gateway to making smart conclusions about...
 Statistics89 views·Updated Jul 2, 2026·4 pages
Statistical Inference and Hypothesis Testing Insights

Ellah Marie Ardaniel@ellahmri
1 / 4
1
of 4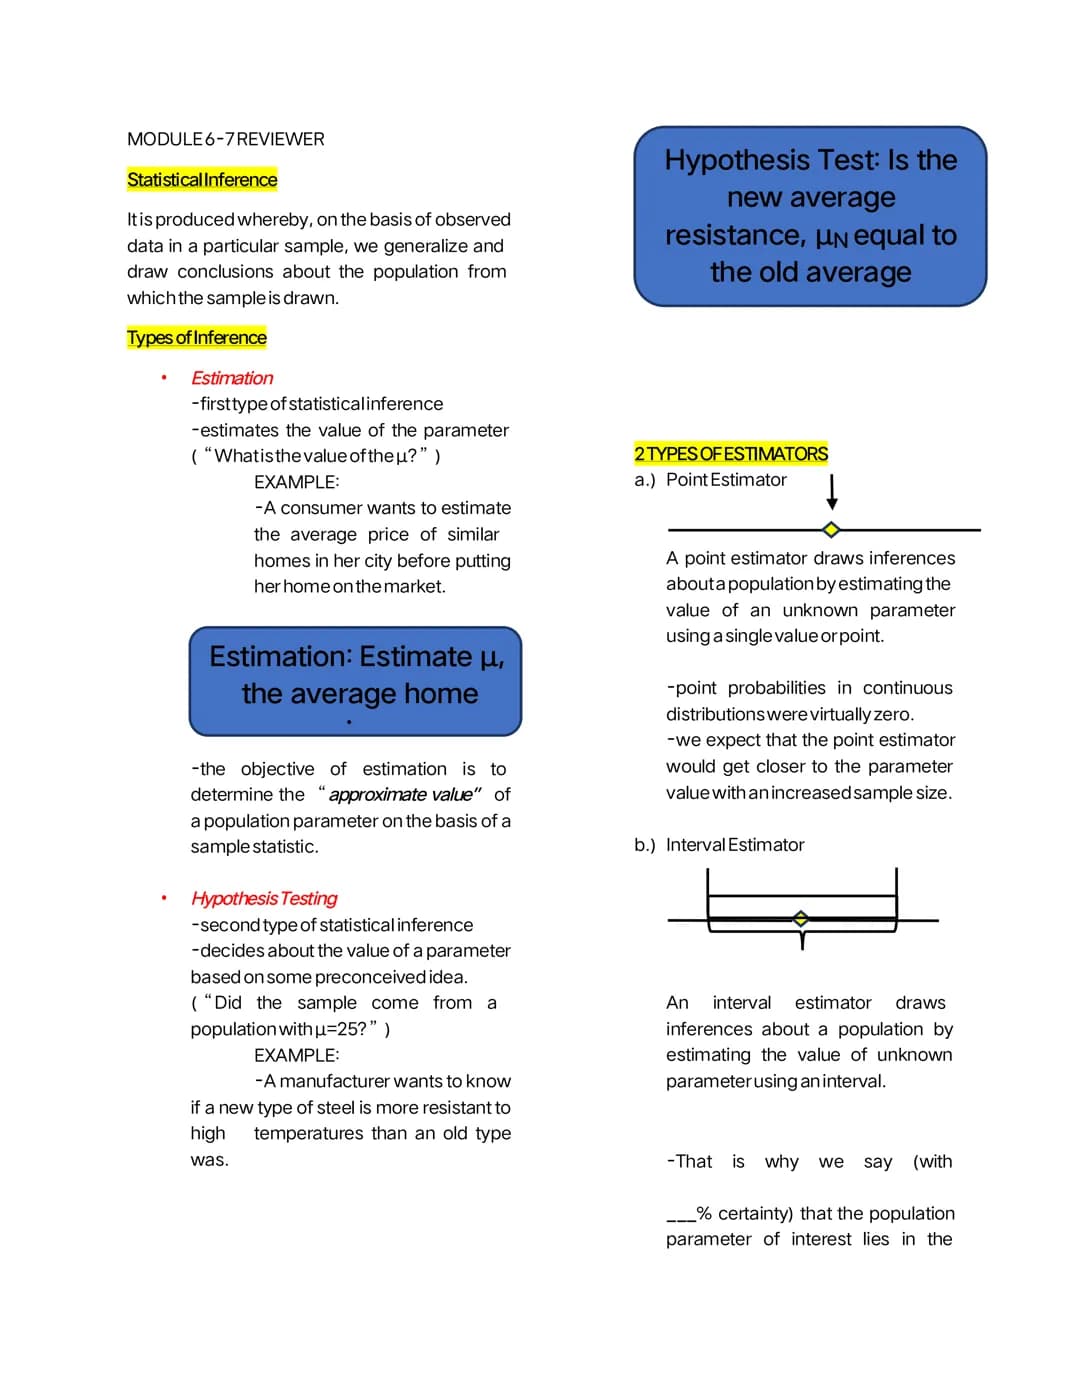
Statistical Inference Basics
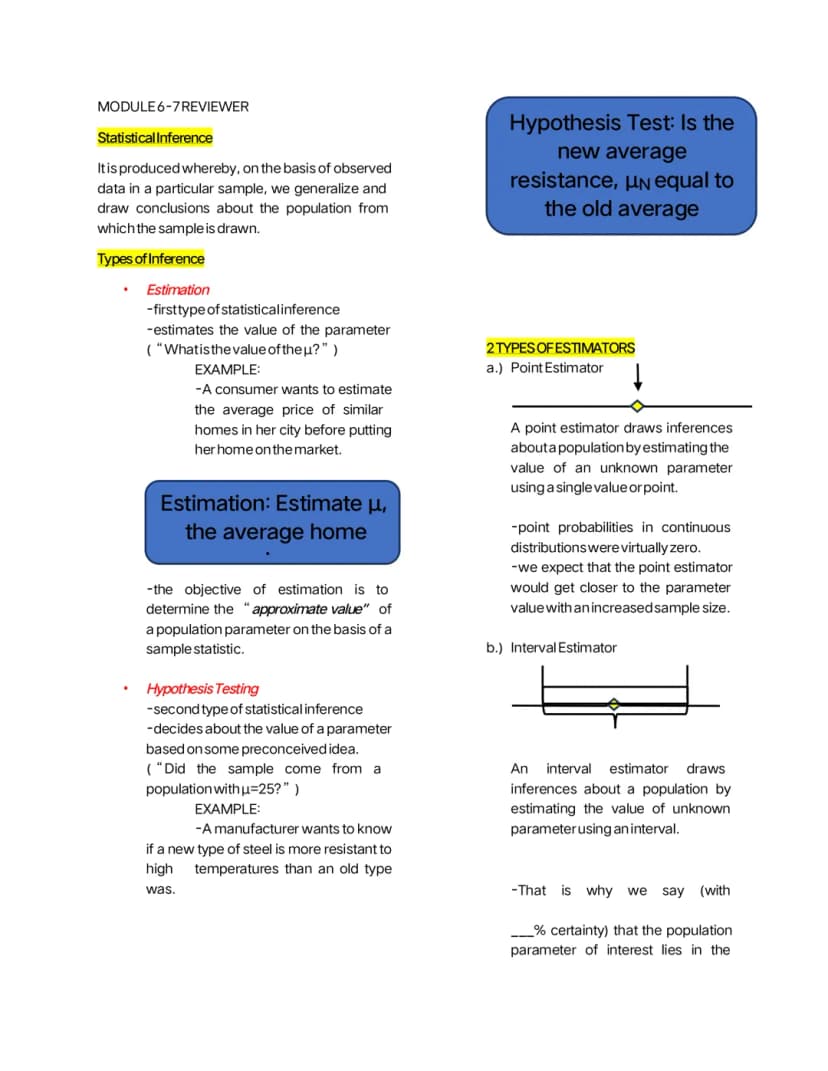
Ever wondered how pollsters predict election results from surveying just a few thousand people? That's statistical inference in action! It's the process of taking what you observe in a sample and making educated conclusions about the entire population.
There are two main ways to approach this. Estimation is like asking "What's the actual value?" - for example, a homeowner wanting to know the average house price in their area before selling. Hypothesis testing is more like asking "Is this claim true?" - such as a manufacturer testing whether their new steel is actually stronger than the old version.
When it comes to estimation, you've got two choices. A point estimator gives you one specific number (like saying the average height is exactly 170cm), whilst an interval estimator gives you a range with a confidence level (like saying you're 95% certain the average height is between 168-172cm). Interval estimates are usually more realistic since hitting an exact number is nearly impossible in real life.
Key Insight: Point estimates are precise but unlikely to be exactly right, while interval estimates give you a realistic range with measurable confidence.
2
of 4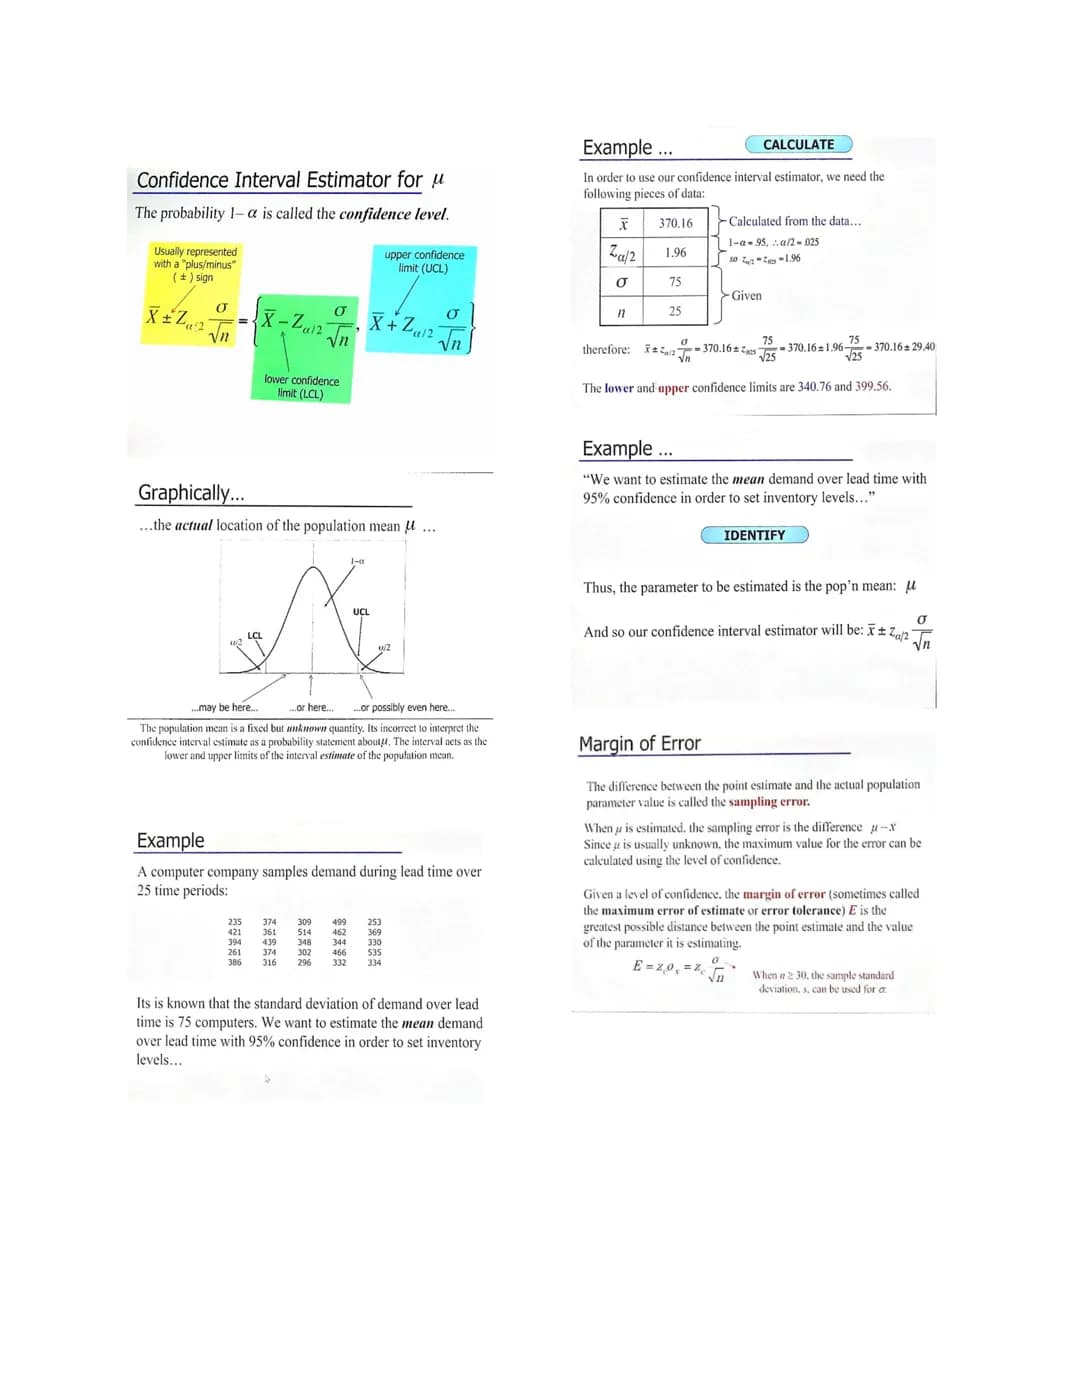
Confidence Intervals and Calculations
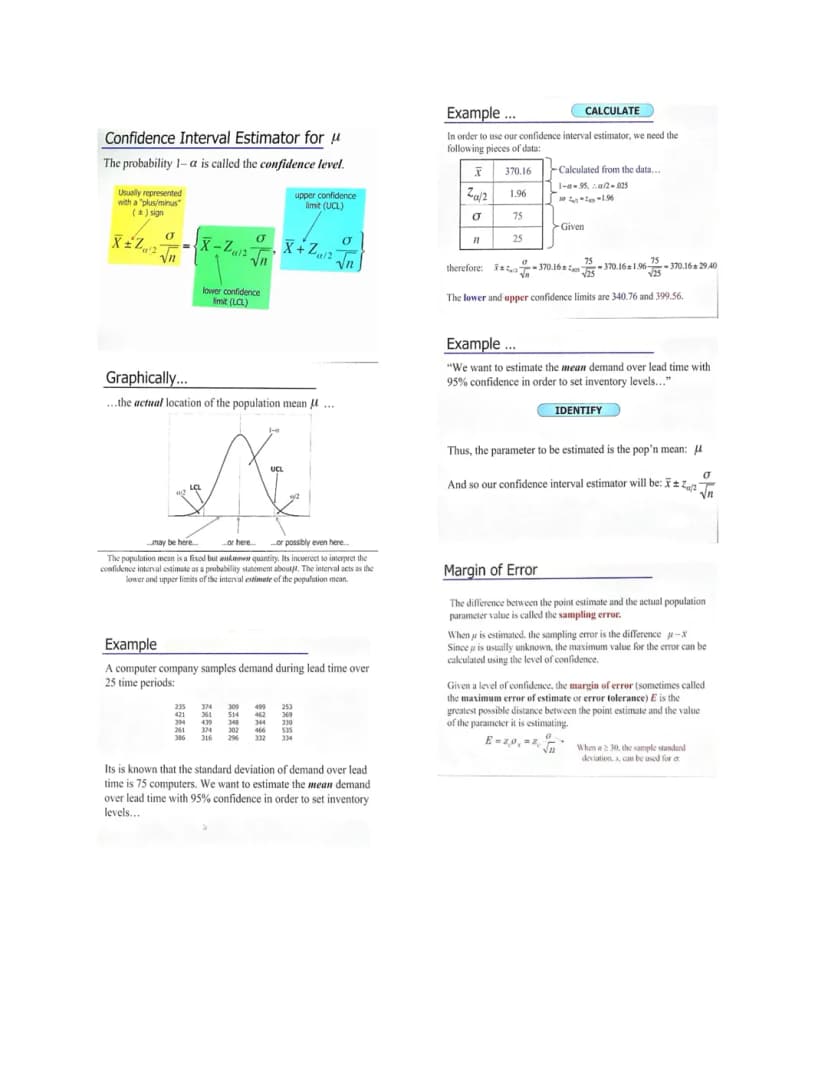
Here's where the maths gets practical! A confidence interval uses this formula: X̄ ± Z × σ/√n. Don't let the symbols scare you - it's just your sample average, plus or minus a margin of error.
Let's break down a real example. A computer company tracked demand over 25 periods and found an average of 370.16 computers. With a known standard deviation of 75 and wanting 95% confidence, they calculated: 370.16 ± 29.40. This gives them a range of 340.76 to 399.56 computers.
The margin of error tells you the maximum distance your estimate might be from the true value. It's calculated as E = Z × σ/√n. The bigger your sample size , the smaller your margin of error becomes - which is why larger surveys tend to be more accurate.
Remember this handy rule: when your sample size is 30 or more, you can use your sample standard deviation instead of the population standard deviation (σ). This makes calculations much more practical in real-world situations.
Pro Tip: Larger sample sizes always give you smaller margins of error and more reliable confidence intervals.
3
of 4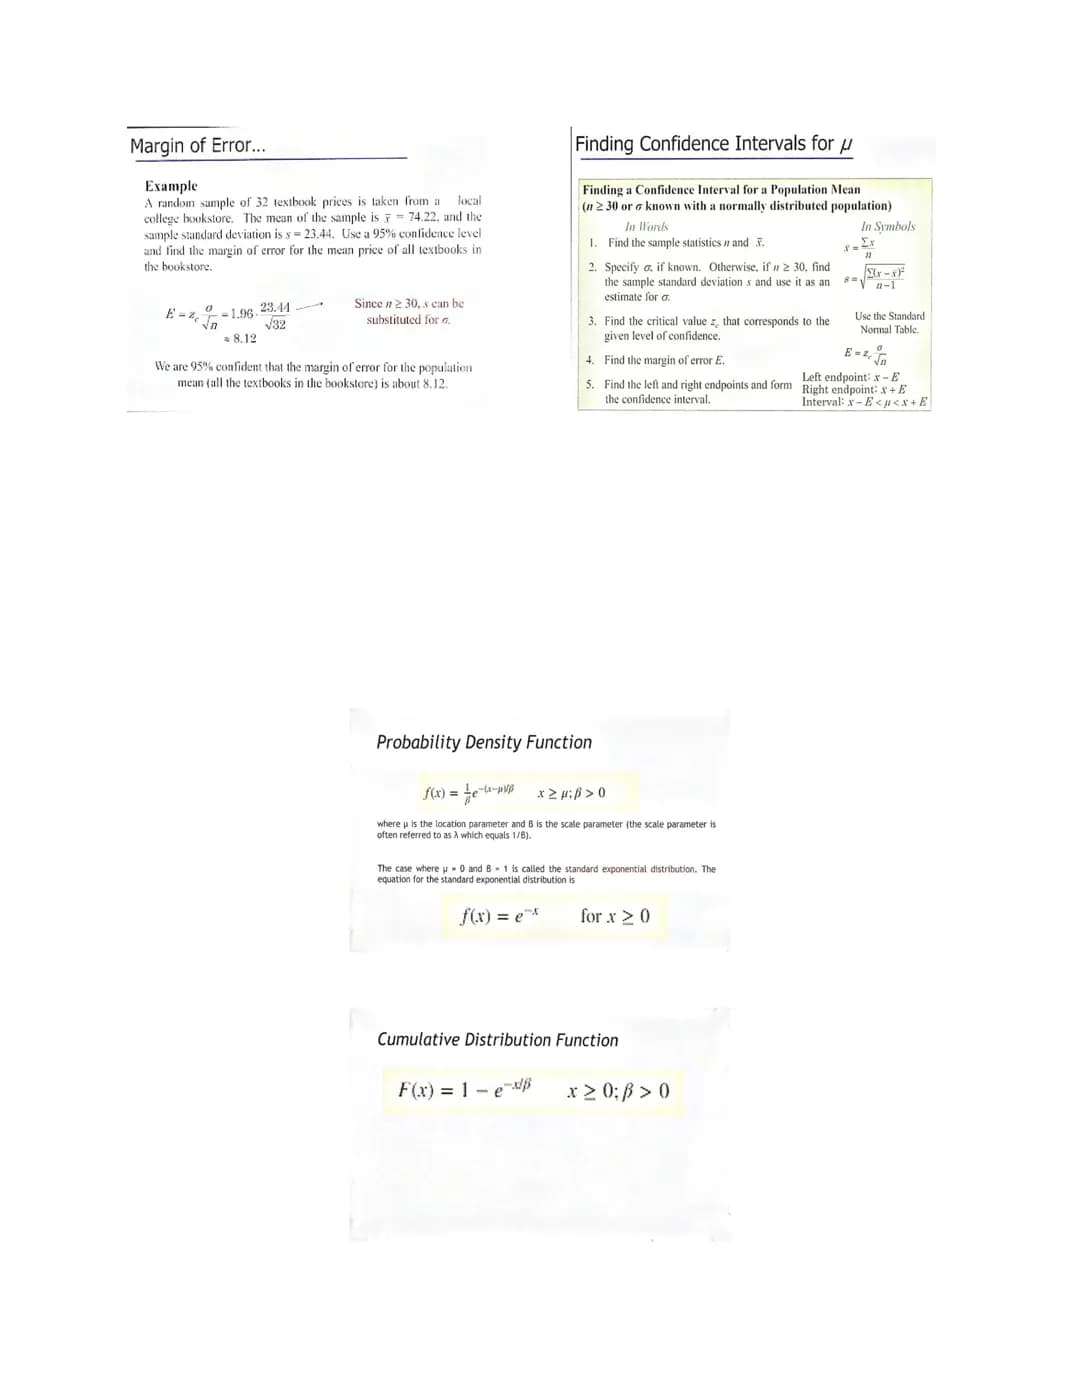
Building Confidence Intervals Step-by-Step
Building a confidence interval is like following a recipe - get the steps right and you'll cook up reliable results every time. Start by finding your sample size and sample mean (x̄), then determine your standard deviation.
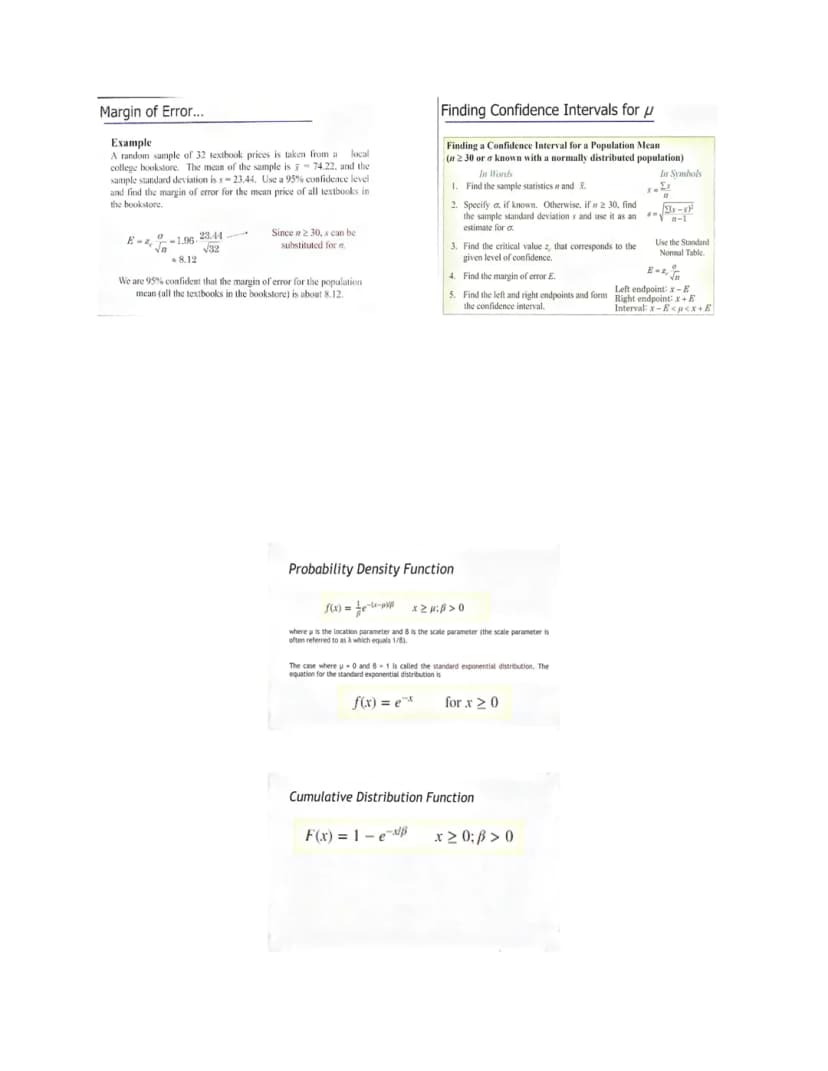
Here's a textbook example that shows how straightforward this can be. With 32 textbook prices averaging £74.22 and a sample standard deviation of £23.44, the margin of error at 95% confidence works out to about £8.12. This means the true average price for all textbooks is likely within £8.12 of your sample average.
The process follows five clear steps: gather your sample statistics, identify your standard deviation, find the critical z-value for your confidence level, calculate the margin of error, and finally create your interval. Your final answer will be in the format: left endpoint < μ < right endpoint.
Exponential distributions also pop up in statistics, particularly when dealing with waiting times or reliability studies. The standard exponential distribution has the simple formula f = e^, making it surprisingly manageable once you get the hang of it.
Reality Check: A 95% confidence interval doesn't mean there's a 95% chance the true value lies within your range - it means if you repeated this process 100 times, about 95 of your intervals would contain the true value.
4
of 4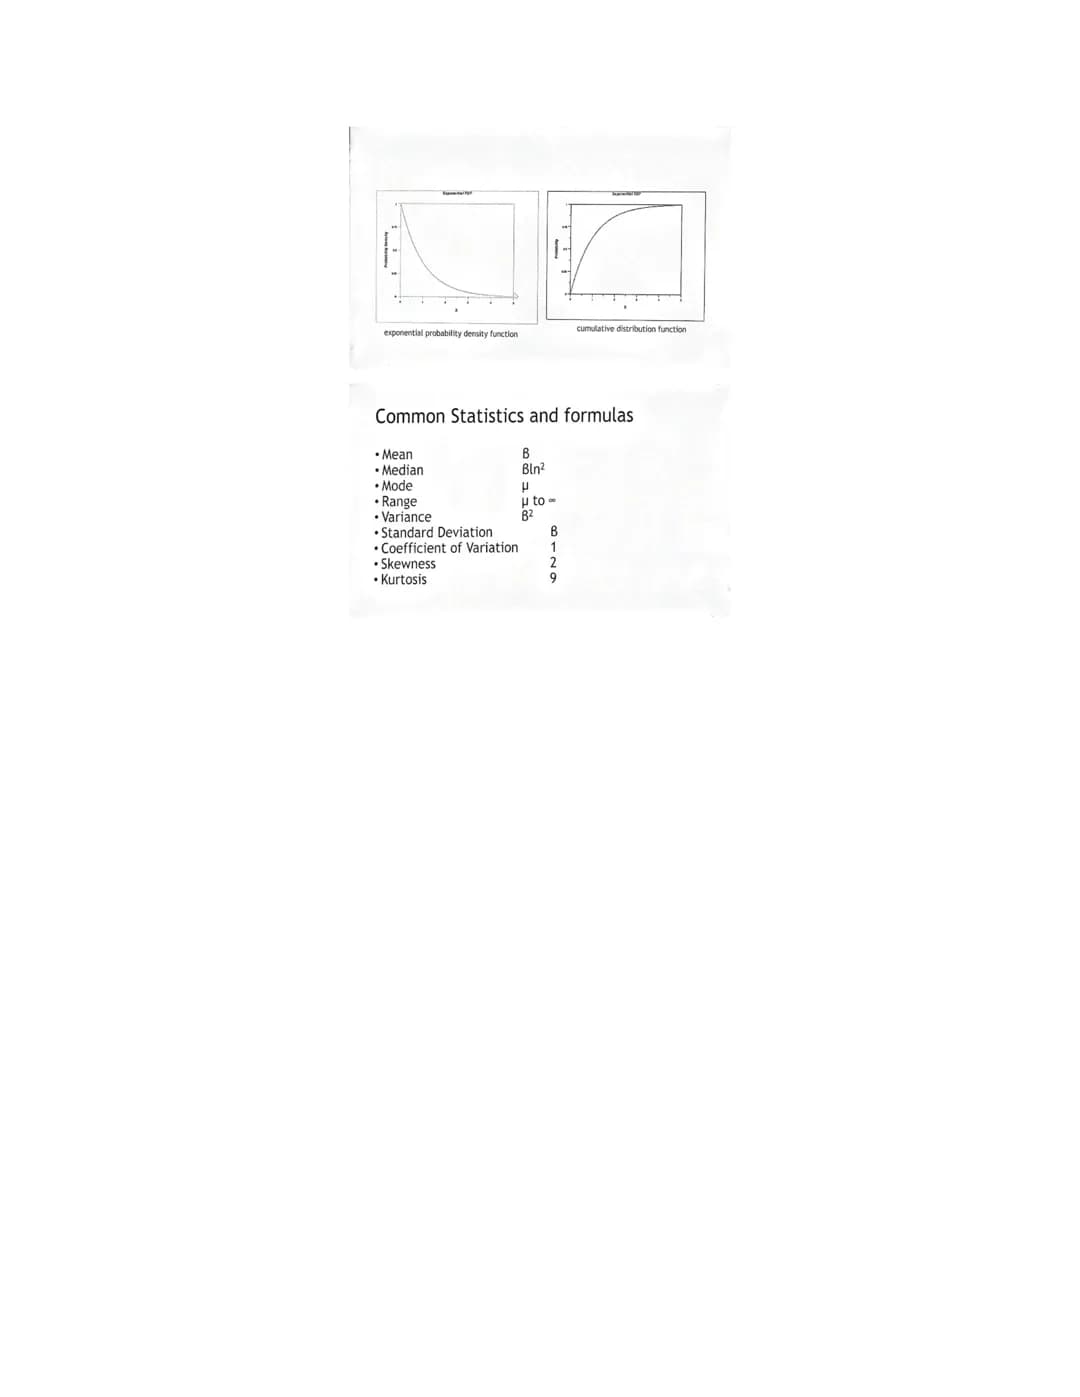
Essential Statistical Measures
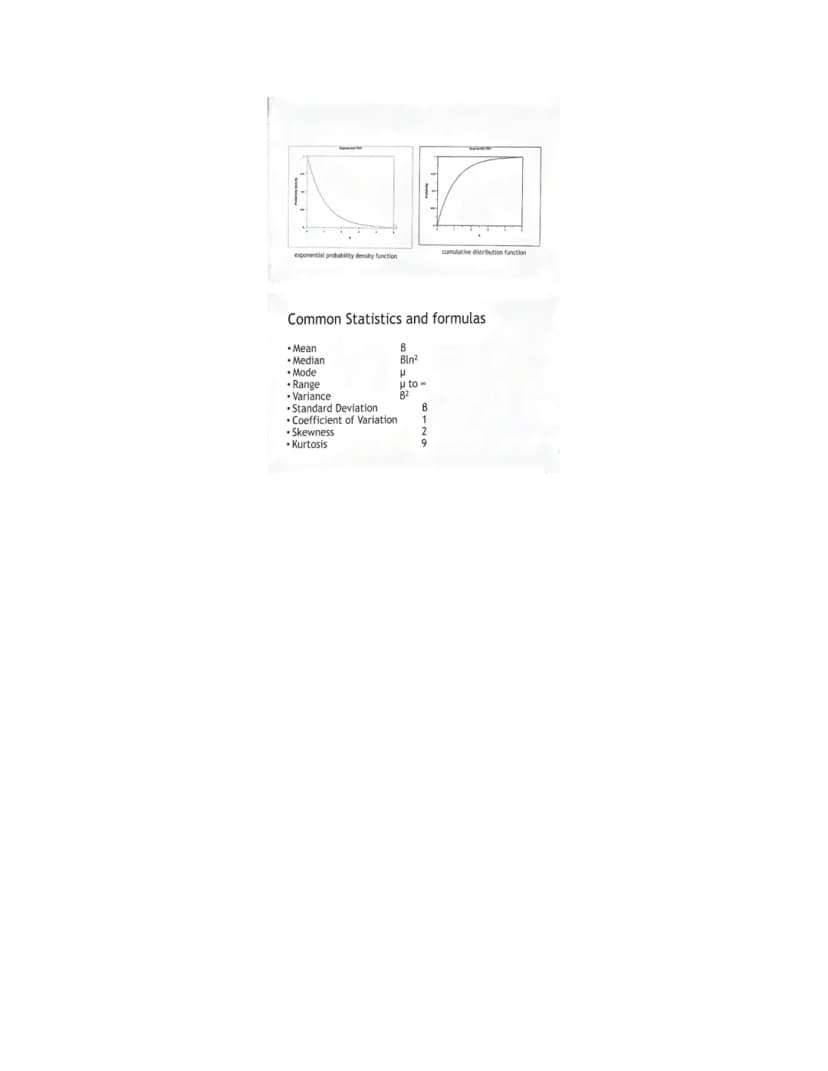
Every statistician needs a toolkit of basic measures, and these common statistics form the foundation of data analysis. You'll use mean, median, and mode to understand central tendencies, whilst range, variance, and standard deviation help you grasp how spread out your data is.
The coefficient of variation compares variability relative to the mean, making it brilliant for comparing datasets with different units or scales. Meanwhile, skewness tells you if your data leans left or right, and kurtosis indicates whether your distribution has heavy or light tails compared to a normal distribution.
These measures work together like instruments in an orchestra - each one tells you something different about your data's story. Master these basics, and you'll have the foundation to tackle more complex statistical challenges with confidence.
Essential Truth: Understanding these fundamental statistics is like learning to read - once you've got them down, the whole world of data analysis opens up to you.
We thought you’d never ask...
Our AI companion is specifically built for the needs of students. Based on the millions of content pieces we have on the platform we can provide truly meaningful and relevant answers to students. But its not only about answers, the companion is even more about guiding students through their daily learning challenges, with personalised study plans, quizzes or content pieces in the chat and 100% personalisation based on the students skills and developments.
You can download the app in the Google Play Store and in the Apple App Store.
That's right! Enjoy free access to study content, connect with fellow students, and get instant help – all at your fingertips.
Similar Content
Most popular content in Maths
9 Maths
MathsComprehensive Maths Concepts
Explore essential mathematical concepts including powers, geometry, statistics, and probability. This resource features 65 pages of detailed explanations, diagrams, and examples to enhance your understanding of topics such as right triangles, volume calculations, and data representation. Ideal for students seeking to strengthen their numeracy skills and grasp complex mathematical principles.
1080,0696,320
MathsUnderstanding Histograms
Explore the fundamentals of histograms, including their structure, frequency density calculations, and practical examples. This summary covers key concepts such as continuous data representation, bar spacing, and how to interpret histograms through provided tables and graphs. Ideal for exam preparation and enhancing your understanding of data visualization.
1083610
MathsStatistical Averages Explained
Explore the concepts of mean, median, mode, and range in this detailed summary. Learn how to calculate each measure of central tendency with clear examples and step-by-step explanations. Ideal for students seeking to understand basic statistics.
S11825
B
 Statistics
business production methods
business production
S41952
 English Literature
UCAT Mastery Techniques
Unlock your potential with this comprehensive guide to mastering the UCAT. Covering essential strategies for Verbal Reasoning, Quantitative Reasoning, Abstract Reasoning, and Situational Judgement, this resource provides in-depth insights into effective reading strategies, ethical considerations, and problem-solving techniques. Perfect for students preparing for the medical aptitude test, this guide emphasizes practice exams and cognitive processes to enhance your performance. Get ready to excel in your UCAT preparation!
121,18740
MathsHistogram Techniques
Master histogram creation and interpretation with this comprehensive guide. Learn essential exam tips, formulas, and methods for calculating frequency density and estimating means from histograms. Ideal for students preparing for exams in statistics and data analysis.
113227
MathsUnderstanding Probability Basics
Explore the fundamentals of probability, including the probability scale, theoretical and experimental probability, and how to calculate outcomes using fractions, decimals, and percentages. This summary provides essential insights for mastering probability concepts in statistics.
1068114
MathsUnderstanding Error Intervals
Explore the concept of error intervals, including how to determine maximum and minimum values for rounded and truncated numbers. This summary provides clear examples and step-by-step methods for calculating error bounds, essential for mastering numerical accuracy in mathematics.
1069113
MathsError Intervals Explained
Explore the concept of error intervals in rounding and truncation with detailed examples. This summary covers how to determine error bounds for numbers rounded to different decimal places and significant figures, providing clear calculations and intervals for better understanding.
1177214
Most popular content
9 Sociology
Sociology of Education Overview
Explore comprehensive A-Level Sociology notes on the education system, covering key theories, policies, and sociological perspectives. This resource includes insights on marketisation, gender roles, cultural deprivation, and educational inequalities, providing a thorough understanding of how education shapes social stratification and individual achievement. Ideal for exam preparation and in-depth study.
12102,8933,041
SociologySociology of Families: Comprehensive Revision
Dive into an extensive overview of family dynamics, perspectives, and patterns in sociology. This resource covers key concepts such as family diversity, gender roles, marriage, and the impact of social policies on family structures. Perfect for A-Level Sociology students preparing for Paper 2.
1273,6842,307
CriminologyCriminology: Crime & Punishment Overview
Comprehensive mindmaps covering key concepts in the Crime and Punishment topic for WJEC Criminology Unit 4. This resource includes detailed insights into the Criminal Justice System, crime prevention strategies, sentencing models, and the roles of various agencies. Ideal for A-Level revision, ensuring you grasp essential theories and legislative processes to excel in your exams.
1254,8751,059
SociologyComprehensive Crime & Deviance Overview
Explore an extensive revision of crime and deviance topics, including theories, types of crime, and the impact of media. This resource covers key concepts such as Marxism, functionalism, gender and crime, and the influence of globalization on criminal behavior. Ideal for students seeking a thorough understanding of criminology and its various theories. Type: Full Topic Revision.
1251,6611,399
C
 Biology
Cell Biology and Cell structure
cell structures
93,2570
English LiteratureAn Inspector Calls: Character Insights
Explore in-depth analysis and key quotes for characters in J.B. Priestley's 'An Inspector Calls'. This resource covers Gerald Croft, Inspector Goole, Sheila Birling, Mrs. Birling, Eric Birling, and Eva Smith, focusing on themes of class, gender roles, and social responsibility. Ideal for students aiming for Grade 8 and above.
1025,436907
CriminologyWJEC Unit 4 Criminology
Criminology unit 4 detailed revision note
127,156125
CriminologyCriminology Theories Overview
Explore key criminology theories and their implications on crime and deviance. This comprehensive summary covers biological, psychological, and sociological perspectives, including labelling theory, right realism, and the impact of social campaigns on policy development. Ideal for A-Level criminology students seeking to understand the complexities of criminal behaviour and the factors influencing crime prevention strategies.
129,763210
English LiteratureRomeo and Juliet: Key themes
Key Romeo and Juliet themes and analysed quotes
106,712198
Students love us — and so will you.
4.6/5App Store
4.7/5Google Play
The app is very easy to use and well designed. I have found everything I was looking for so far and have been able to learn a lot from the presentations! I will definitely use the app for a class assignment! And of course it also helps a lot as an inspiration.
Stefan SiOS user
This app is really great. There are so many study notes and help [...]. My problem subject is French, for example, and the app has so many options for help. Thanks to this app, I have improved my French. I would recommend it to anyone.
Samantha KlichAndroid user
Wow, I am really amazed. I just tried the app because I've seen it advertised many times and was absolutely stunned. This app is THE HELP you want for school and above all, it offers so many things, such as workouts and fact sheets, which have been VERY helpful to me personally.
AnnaiOS user
Statistics89 views·Updated Jul 2, 2026·4 pagesStatistical Inference and Hypothesis Testing Insights
Ellah Marie Ardaniel@ellahmri
Statistical inference is your gateway to making smart conclusions about entire populations based on just a sample of data. Think of it like tasting one spoonful of soup to judge the whole pot - you're using what you observe in...
1
of 4
Sign up to see the content. It's free!
- Access to all documents
- Improve your grades
- Join milions of students
Statistical Inference Basics
Ever wondered how pollsters predict election results from surveying just a few thousand people? That's statistical inference in action! It's the process of taking what you observe in a sample and making educated conclusions about the entire population.
There are two main ways to approach this. Estimation is like asking "What's the actual value?" - for example, a homeowner wanting to know the average house price in their area before selling. Hypothesis testing is more like asking "Is this claim true?" - such as a manufacturer testing whether their new steel is actually stronger than the old version.
When it comes to estimation, you've got two choices. A point estimator gives you one specific number (like saying the average height is exactly 170cm), whilst an interval estimator gives you a range with a confidence level (like saying you're 95% certain the average height is between 168-172cm). Interval estimates are usually more realistic since hitting an exact number is nearly impossible in real life.
Key Insight: Point estimates are precise but unlikely to be exactly right, while interval estimates give you a realistic range with measurable confidence.
2
of 4Sign up to see the content. It's free!
- Access to all documents
- Improve your grades
- Join milions of students
Confidence Intervals and Calculations
Here's where the maths gets practical! A confidence interval uses this formula: X̄ ± Z × σ/√n. Don't let the symbols scare you - it's just your sample average, plus or minus a margin of error.
Let's break down a real example. A computer company tracked demand over 25 periods and found an average of 370.16 computers. With a known standard deviation of 75 and wanting 95% confidence, they calculated: 370.16 ± 29.40. This gives them a range of 340.76 to 399.56 computers.
The margin of error tells you the maximum distance your estimate might be from the true value. It's calculated as E = Z × σ/√n. The bigger your sample size , the smaller your margin of error becomes - which is why larger surveys tend to be more accurate.
Remember this handy rule: when your sample size is 30 or more, you can use your sample standard deviation instead of the population standard deviation (σ). This makes calculations much more practical in real-world situations.
Pro Tip: Larger sample sizes always give you smaller margins of error and more reliable confidence intervals.
3
of 4Sign up to see the content. It's free!
- Access to all documents
- Improve your grades
- Join milions of students
Building Confidence Intervals Step-by-Step
Building a confidence interval is like following a recipe - get the steps right and you'll cook up reliable results every time. Start by finding your sample size and sample mean (x̄), then determine your standard deviation.
Here's a textbook example that shows how straightforward this can be. With 32 textbook prices averaging £74.22 and a sample standard deviation of £23.44, the margin of error at 95% confidence works out to about £8.12. This means the true average price for all textbooks is likely within £8.12 of your sample average.
The process follows five clear steps: gather your sample statistics, identify your standard deviation, find the critical z-value for your confidence level, calculate the margin of error, and finally create your interval. Your final answer will be in the format: left endpoint < μ < right endpoint.
Exponential distributions also pop up in statistics, particularly when dealing with waiting times or reliability studies. The standard exponential distribution has the simple formula f = e^, making it surprisingly manageable once you get the hang of it.
Reality Check: A 95% confidence interval doesn't mean there's a 95% chance the true value lies within your range - it means if you repeated this process 100 times, about 95 of your intervals would contain the true value.
4
of 4Sign up to see the content. It's free!
- Access to all documents
- Improve your grades
- Join milions of students
Essential Statistical Measures
Every statistician needs a toolkit of basic measures, and these common statistics form the foundation of data analysis. You'll use mean, median, and mode to understand central tendencies, whilst range, variance, and standard deviation help you grasp how spread out your data is.
The coefficient of variation compares variability relative to the mean, making it brilliant for comparing datasets with different units or scales. Meanwhile, skewness tells you if your data leans left or right, and kurtosis indicates whether your distribution has heavy or light tails compared to a normal distribution.
These measures work together like instruments in an orchestra - each one tells you something different about your data's story. Master these basics, and you'll have the foundation to tackle more complex statistical challenges with confidence.
Essential Truth: Understanding these fundamental statistics is like learning to read - once you've got them down, the whole world of data analysis opens up to you.
We thought you’d never ask...
Our AI companion is specifically built for the needs of students. Based on the millions of content pieces we have on the platform we can provide truly meaningful and relevant answers to students. But its not only about answers, the companion is even more about guiding students through their daily learning challenges, with personalised study plans, quizzes or content pieces in the chat and 100% personalisation based on the students skills and developments.
You can download the app in the Google Play Store and in the Apple App Store.
That's right! Enjoy free access to study content, connect with fellow students, and get instant help – all at your fingertips.
Similar Content
Most popular content in Maths
9MathsComprehensive Maths Concepts
Explore essential mathematical concepts including powers, geometry, statistics, and probability. This resource features 65 pages of detailed explanations, diagrams, and examples to enhance your understanding of topics such as right triangles, volume calculations, and data representation. Ideal for students seeking to strengthen their numeracy skills and grasp complex mathematical principles.
1080,0696,320
MathsUnderstanding Histograms
Explore the fundamentals of histograms, including their structure, frequency density calculations, and practical examples. This summary covers key concepts such as continuous data representation, bar spacing, and how to interpret histograms through provided tables and graphs. Ideal for exam preparation and enhancing your understanding of data visualization.
1083610
MathsStatistical Averages Explained
Explore the concepts of mean, median, mode, and range in this detailed summary. Learn how to calculate each measure of central tendency with clear examples and step-by-step explanations. Ideal for students seeking to understand basic statistics.
S11825
B
Statisticsbusiness production methods
business production
S41952
English LiteratureUCAT Mastery Techniques
Unlock your potential with this comprehensive guide to mastering the UCAT. Covering essential strategies for Verbal Reasoning, Quantitative Reasoning, Abstract Reasoning, and Situational Judgement, this resource provides in-depth insights into effective reading strategies, ethical considerations, and problem-solving techniques. Perfect for students preparing for the medical aptitude test, this guide emphasizes practice exams and cognitive processes to enhance your performance. Get ready to excel in your UCAT preparation!
121,18740
MathsHistogram Techniques
Master histogram creation and interpretation with this comprehensive guide. Learn essential exam tips, formulas, and methods for calculating frequency density and estimating means from histograms. Ideal for students preparing for exams in statistics and data analysis.
113227
MathsUnderstanding Probability Basics
Explore the fundamentals of probability, including the probability scale, theoretical and experimental probability, and how to calculate outcomes using fractions, decimals, and percentages. This summary provides essential insights for mastering probability concepts in statistics.
1068114
MathsUnderstanding Error Intervals
Explore the concept of error intervals, including how to determine maximum and minimum values for rounded and truncated numbers. This summary provides clear examples and step-by-step methods for calculating error bounds, essential for mastering numerical accuracy in mathematics.
1069113
MathsError Intervals Explained
Explore the concept of error intervals in rounding and truncation with detailed examples. This summary covers how to determine error bounds for numbers rounded to different decimal places and significant figures, providing clear calculations and intervals for better understanding.
1177214
Most popular content
9SociologySociology of Education Overview
Explore comprehensive A-Level Sociology notes on the education system, covering key theories, policies, and sociological perspectives. This resource includes insights on marketisation, gender roles, cultural deprivation, and educational inequalities, providing a thorough understanding of how education shapes social stratification and individual achievement. Ideal for exam preparation and in-depth study.
12102,8933,041
SociologySociology of Families: Comprehensive Revision
Dive into an extensive overview of family dynamics, perspectives, and patterns in sociology. This resource covers key concepts such as family diversity, gender roles, marriage, and the impact of social policies on family structures. Perfect for A-Level Sociology students preparing for Paper 2.
1273,6842,307
CriminologyCriminology: Crime & Punishment Overview
Comprehensive mindmaps covering key concepts in the Crime and Punishment topic for WJEC Criminology Unit 4. This resource includes detailed insights into the Criminal Justice System, crime prevention strategies, sentencing models, and the roles of various agencies. Ideal for A-Level revision, ensuring you grasp essential theories and legislative processes to excel in your exams.
1254,8751,059
SociologyComprehensive Crime & Deviance Overview
Explore an extensive revision of crime and deviance topics, including theories, types of crime, and the impact of media. This resource covers key concepts such as Marxism, functionalism, gender and crime, and the influence of globalization on criminal behavior. Ideal for students seeking a thorough understanding of criminology and its various theories. Type: Full Topic Revision.
1251,6611,399
C
BiologyCell Biology and Cell structure
cell structures
93,2570
English LiteratureAn Inspector Calls: Character Insights
Explore in-depth analysis and key quotes for characters in J.B. Priestley's 'An Inspector Calls'. This resource covers Gerald Croft, Inspector Goole, Sheila Birling, Mrs. Birling, Eric Birling, and Eva Smith, focusing on themes of class, gender roles, and social responsibility. Ideal for students aiming for Grade 8 and above.
1025,436907
CriminologyWJEC Unit 4 Criminology
Criminology unit 4 detailed revision note
127,156125
CriminologyCriminology Theories Overview
Explore key criminology theories and their implications on crime and deviance. This comprehensive summary covers biological, psychological, and sociological perspectives, including labelling theory, right realism, and the impact of social campaigns on policy development. Ideal for A-Level criminology students seeking to understand the complexities of criminal behaviour and the factors influencing crime prevention strategies.
129,763210
English LiteratureRomeo and Juliet: Key themes
Key Romeo and Juliet themes and analysed quotes
106,712198
Students love us — and so will you.
4.6/5App Store
4.7/5Google Play
The app is very easy to use and well designed. I have found everything I was looking for so far and have been able to learn a lot from the presentations! I will definitely use the app for a class assignment! And of course it also helps a lot as an inspiration.
Stefan SiOS user
This app is really great. There are so many study notes and help [...]. My problem subject is French, for example, and the app has so many options for help. Thanks to this app, I have improved my French. I would recommend it to anyone.
Samantha KlichAndroid user
Wow, I am really amazed. I just tried the app because I've seen it advertised many times and was absolutely stunned. This app is THE HELP you want for school and above all, it offers so many things, such as workouts and fact sheets, which have been VERY helpful to me personally.
AnnaiOS user