Calculus is the mathematical study of continuous change, essential for...
Complete AP Calculus AB Notebook
Lauren Smith@laurentrees

1 / 10
1
of 10
Systems of Equations
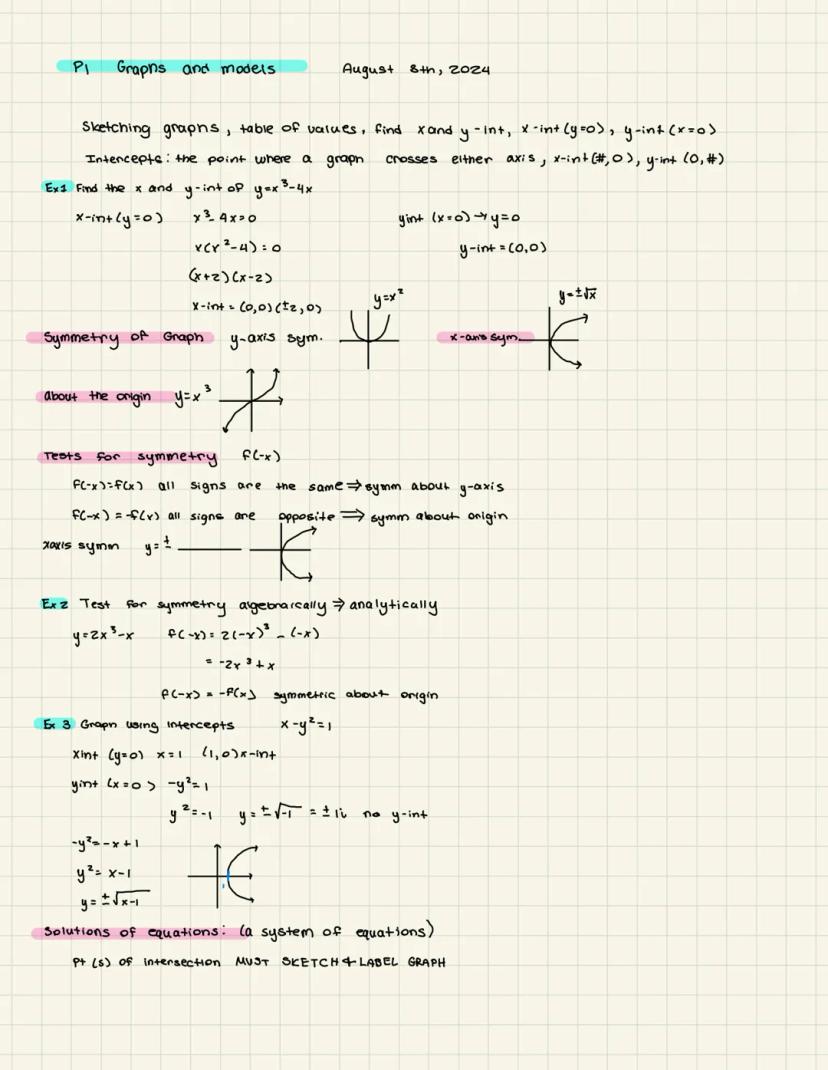
Finding the solution to systems of equations requires identifying where two or more equations intersect. Let's break down the analytical approach!
When solving a system with one linear and one quadratic equation, we can use substitution to find points of intersection. In this method, you isolate a variable from the linear equation and substitute it into the quadratic equation.
For example, if we have the system:
x² - y = 3
x - y = 1
We can rewrite the second equation as y = x - 1, then substitute this into the first equation:
x² - (x - 1) = 3
x² - x + 1 = 3
x² - x - 2 = 0
(x - 2)(x + 1) = 0
This gives us x = 2 or x = -1, which we can plug back into y = x - 1 to find the complete solutions: (2, 1) and .
💡 When solving systems with quadratic equations, always check all solutions by substituting back into both original equations, as some may be extraneous!
2
of 10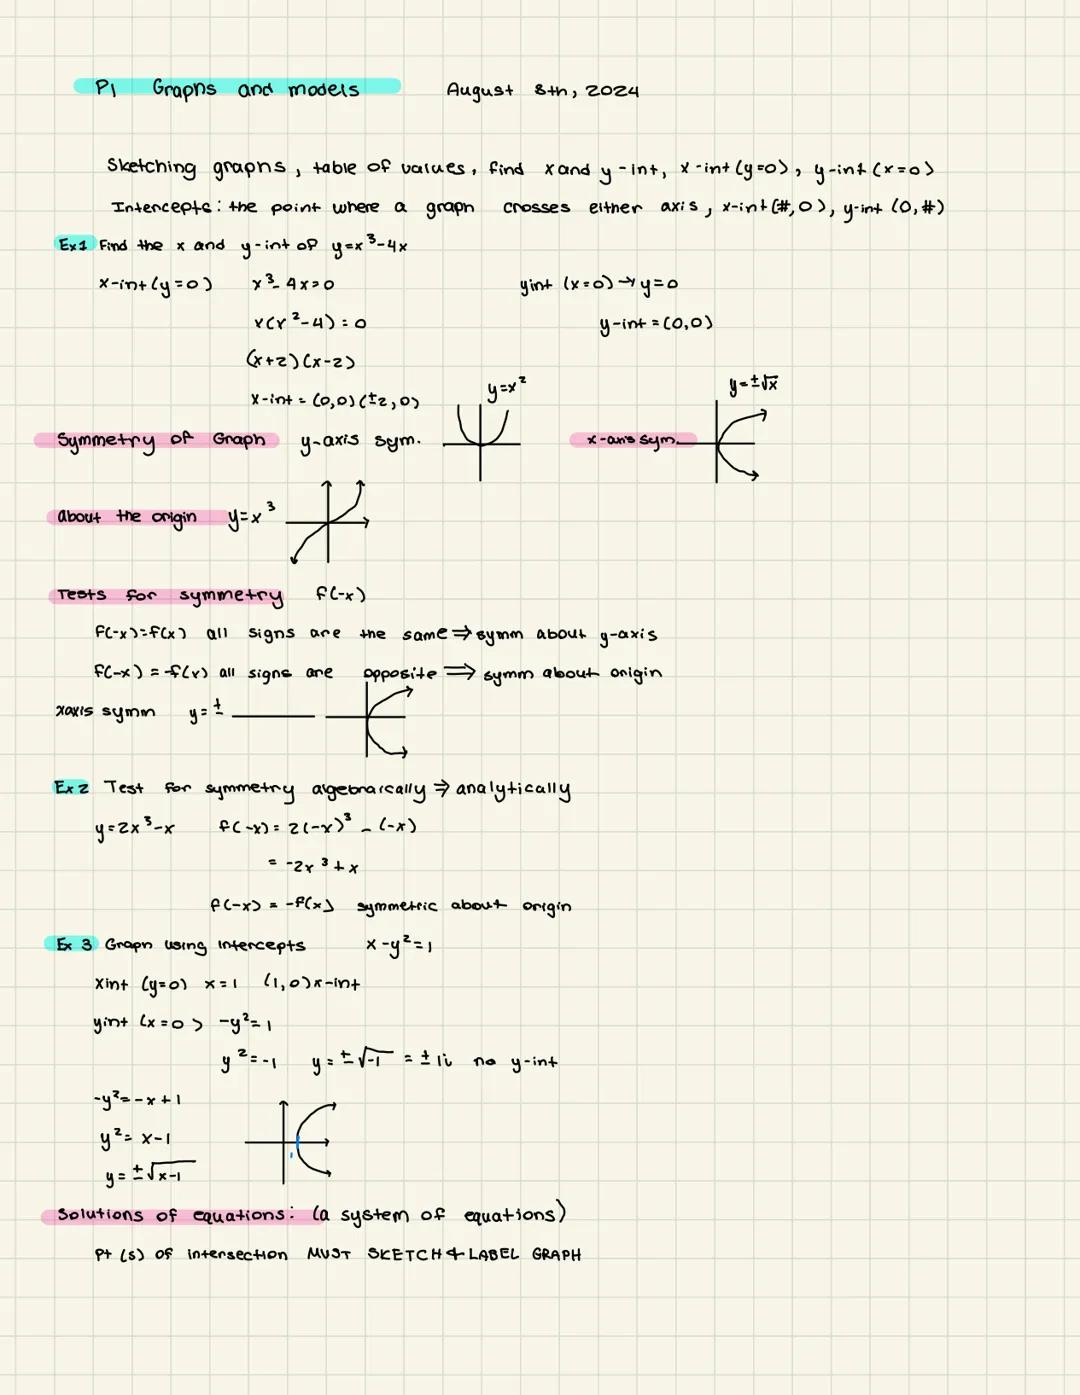
Solving Systems Analytically
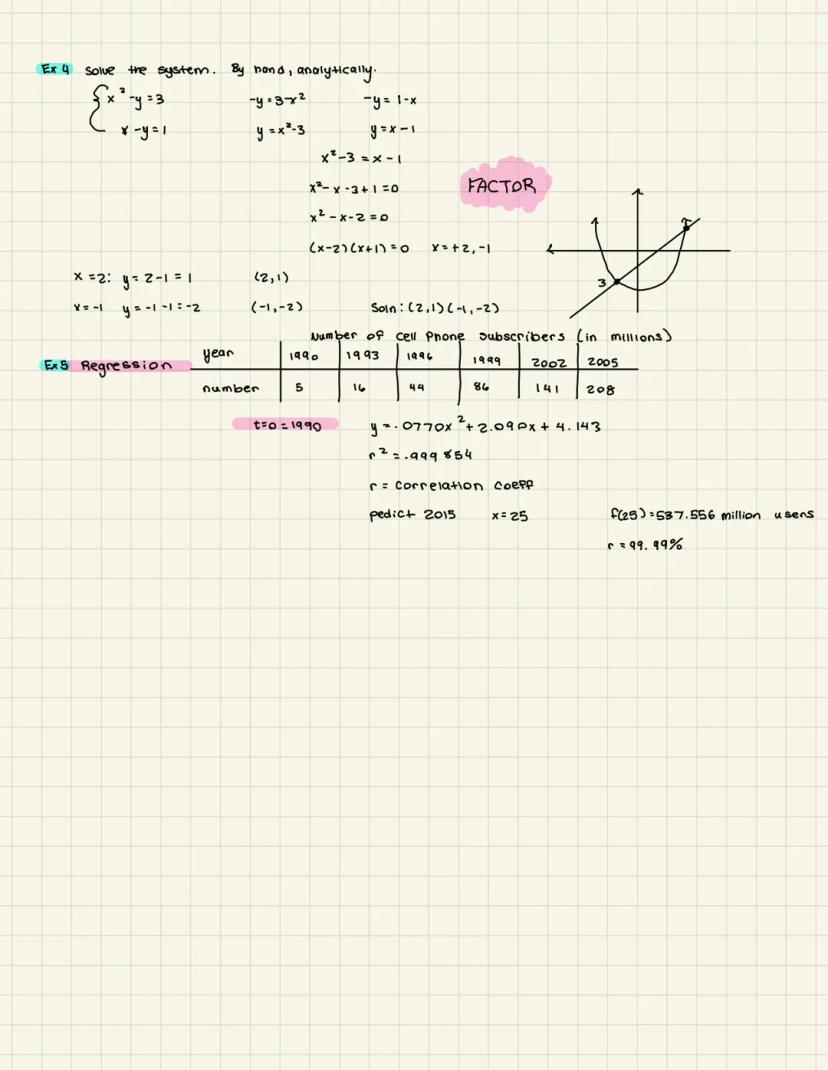
Solving systems of equations by hand requires careful algebraic manipulation. Let's explore a complete example:
For the system:
x² - y = 3
x - y = 1
First, we need to isolate a variable from one equation. From the second equation:
x - y = 1
y = x - 1
Now substitute this expression for y into the first equation:
x² - (x - 1) = 3
x² - x + 1 = 3
x² - x - 2 = 0
(x - 2)(x + 1) = 0
This gives us x = 2 or x = -1.
Substituting back:
- When x = 2: y = 2 - 1 = 1, giving solution (2, 1)
- When x = -1: y = -1 - 1 = -2, giving solution
When working with real-world data, we often use regression analysis to find mathematical models. For example, in the cell phone subscriber data from 1990 to 2005, the quadratic regression model y = 0.077x² + 2.09x + 4.143 fits with 99.9% accuracy .
Using this model, we can predict that by 2015 , there would be approximately 537.556 million cell phone subscribers.
3
of 10
Linear Models and Rate of Change
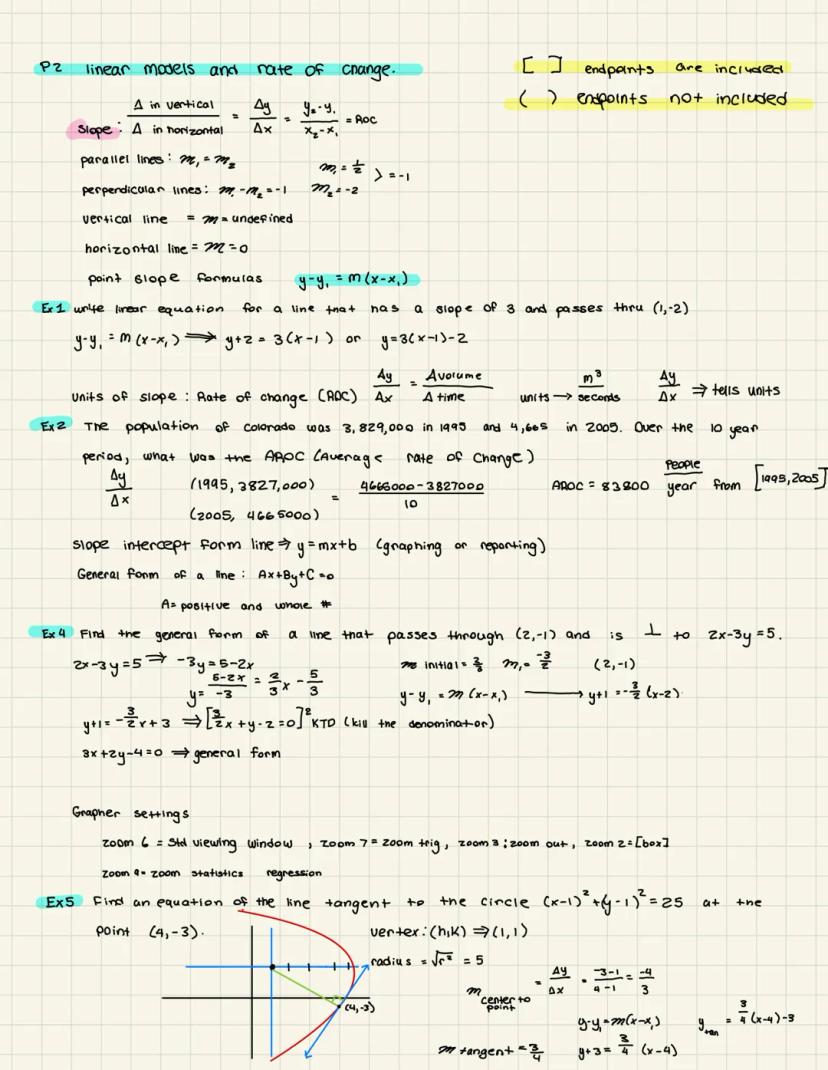
The rate of change between two points is calculated as the ratio of vertical change to horizontal change. This fundamental concept gives us the slope of a line!
Rate of change formula:
ROC = Δy/Δx = (y₂ - y₁)/(x₂ - x₁)
This ratio tells us how much y changes for each unit change in x. For example, if a car travels 120 miles in 2 hours, its rate of change (speed) is 60 miles per hour.
When working with lines, remember these key relationships:
- Parallel lines: have the same slope
- Perpendicular lines: have slopes that are negative reciprocals
- Vertical lines: have undefined slope
- Horizontal lines: have slope = 0
The point-slope formula is a powerful way to write an equation: y - y₁ = m
For example, to write the equation of a line with slope 3 passing through (1,2):
y - 2 = 3(x - 1)
y = 3x - 1
When analyzing real data, like Colorado's population growth from 3,829,000 in 1995 to 4,665,000 in 2005, we can calculate the average rate of change:
AROC = (4,665,000 - 3,827,000)/10 = 83,800 people/year
🔑 The units of slope always reflect the relationship between the quantities—like people/year, meters/second, or dollars/hour.
4
of 10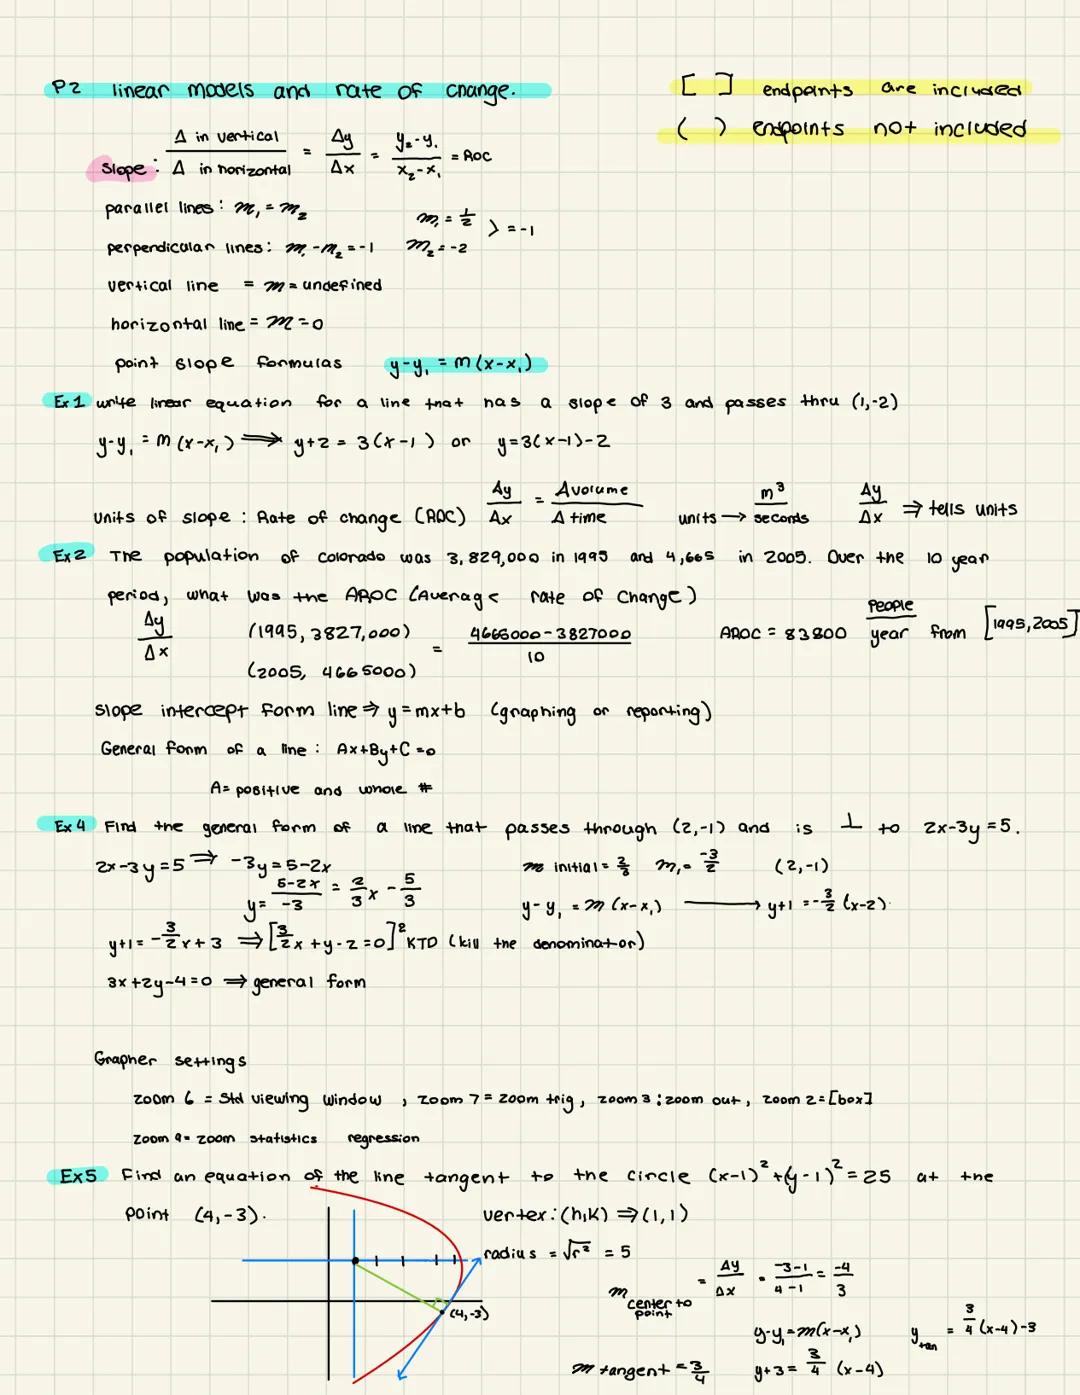
Fitting Models to Data
Data modeling allows us to make predictions and understand relationships between variables. Linear models are among the simplest and most widely used.
When fitting a linear model to data, we look for an equation in the form y = mx + b that best represents the relationship between variables. The process involves calculating the slope and y-intercept that minimize the difference between predicted and actual values.
For data points like height measurements corresponding to different lengths, we can use statistical techniques to find the best-fitting line. The result might look like:
y = 3.203x + 0.955
The correlation coefficient measures how well the model fits the data. In our example, r = 0.964, meaning the model fits 96.4% of the data points—a very strong correlation.
Once we have our model, we can make predictions. For instance, for a length of 75 inches, our model predicts a height of 74.842 inches.
This modeling approach is incredibly useful in fields ranging from economics to engineering, allowing us to understand patterns and make informed decisions based on data.
Remember that while linear models are useful for many relationships, not all data follows a straight line. Sometimes we need quadratic, exponential, or other types of models for accurate representation.
5
of 10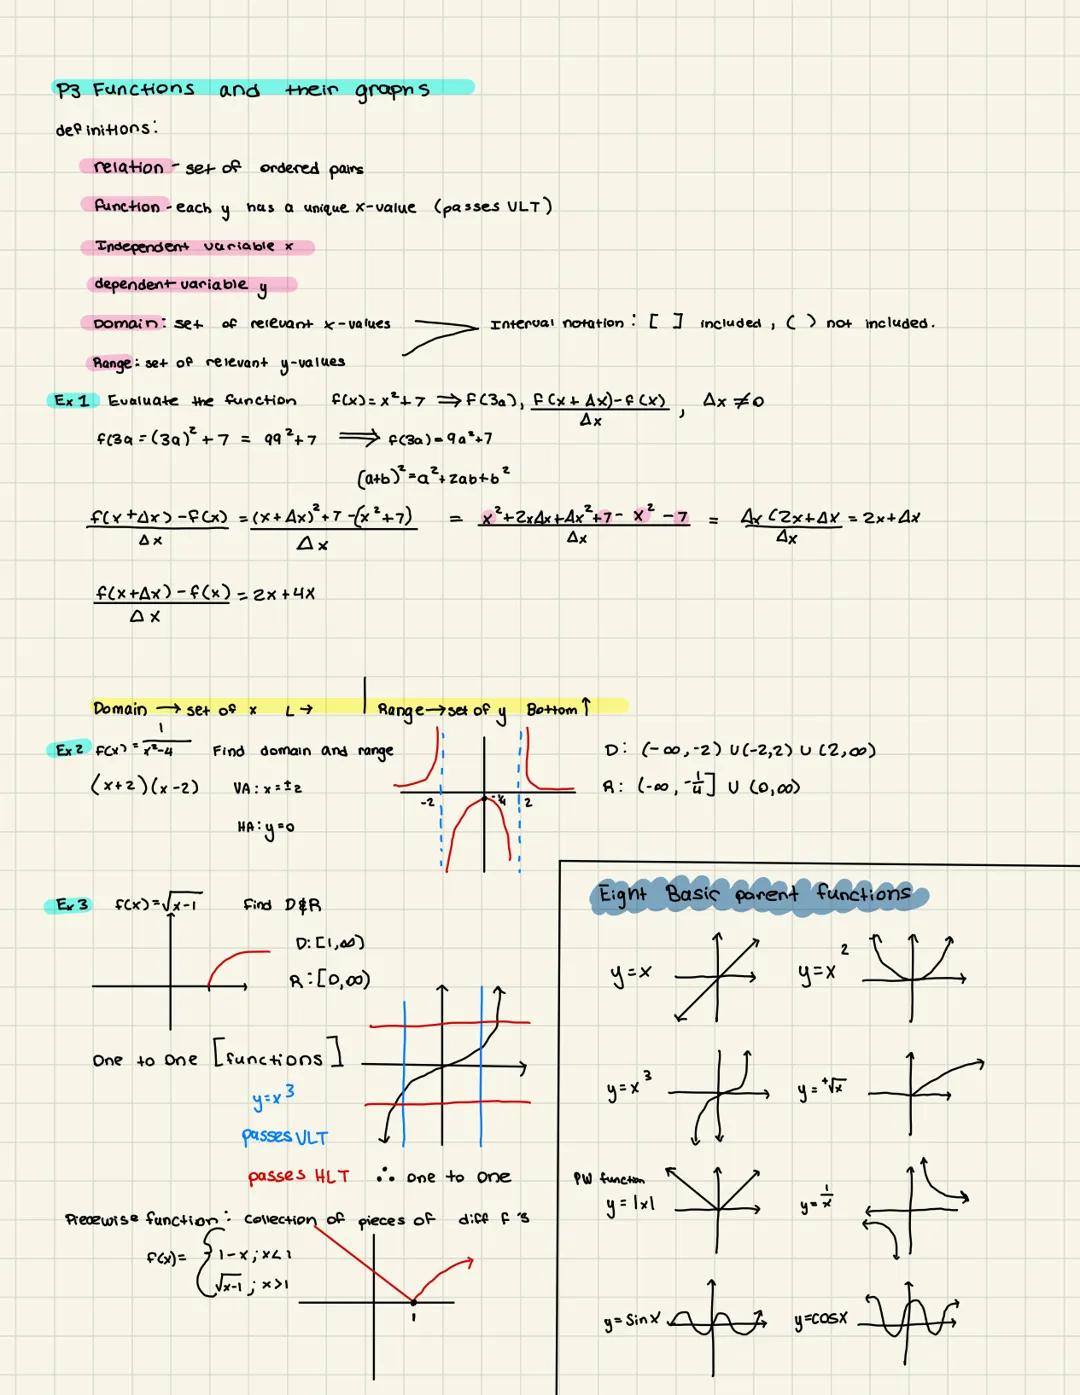
Limits
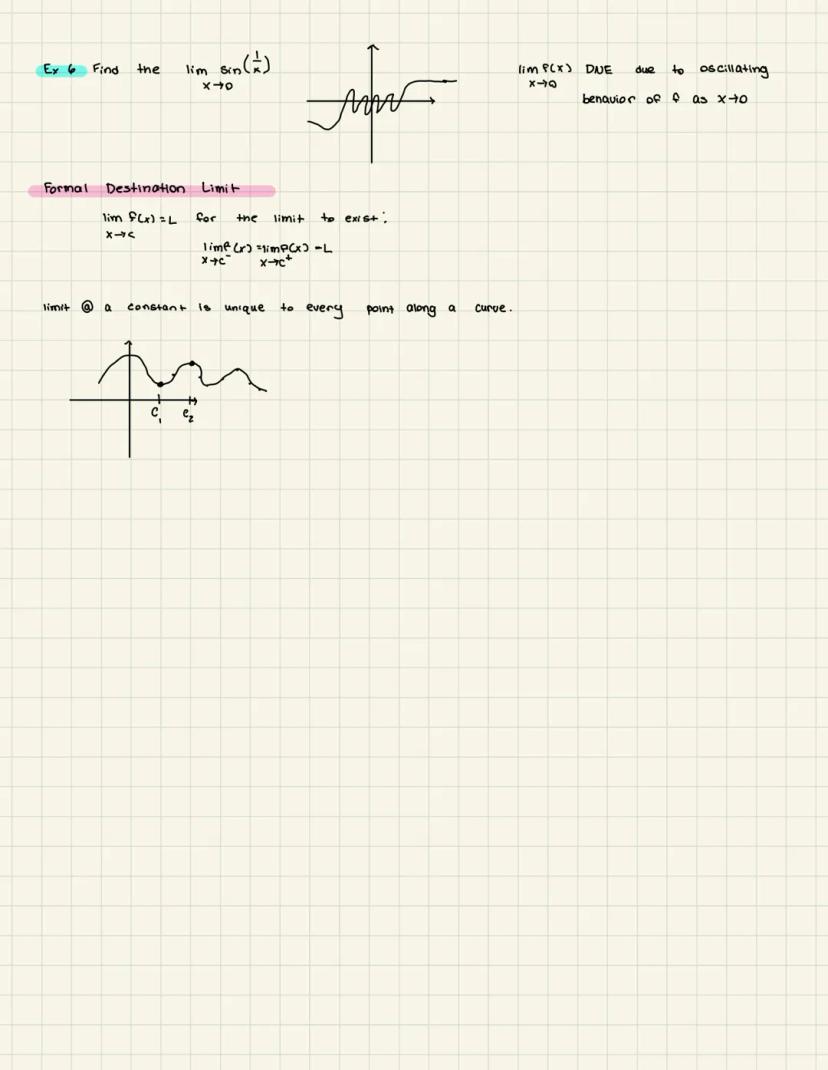
Limits are fundamental to calculus and describe the behavior of a function as its input approaches a specific value.
The notation lim(x→0) sin asks: "What value does sin approach as x gets closer and closer to 0?"
In this example, as x approaches 0, the function sin oscillates rapidly between -1 and 1, never settling on a single value. Therefore, this limit does not exist (DNE) due to the oscillating behavior.
For a limit to exist at a point c, the left-hand limit (approaching from values less than c) must equal the right-hand limit (approaching from values greater than c):
lim(x→c⁻) f(x) = lim(x→c⁺) f(x) = L
Each point along a curve has its own unique limit value, representing the behavior of the function near that point. This concept is essential for defining derivatives and understanding function behavior.
When evaluating limits, we examine what happens as we get arbitrarily close to the point of interest, without actually reaching it. This allows us to understand the behavior of functions even at points where they might not be defined.
6
of 10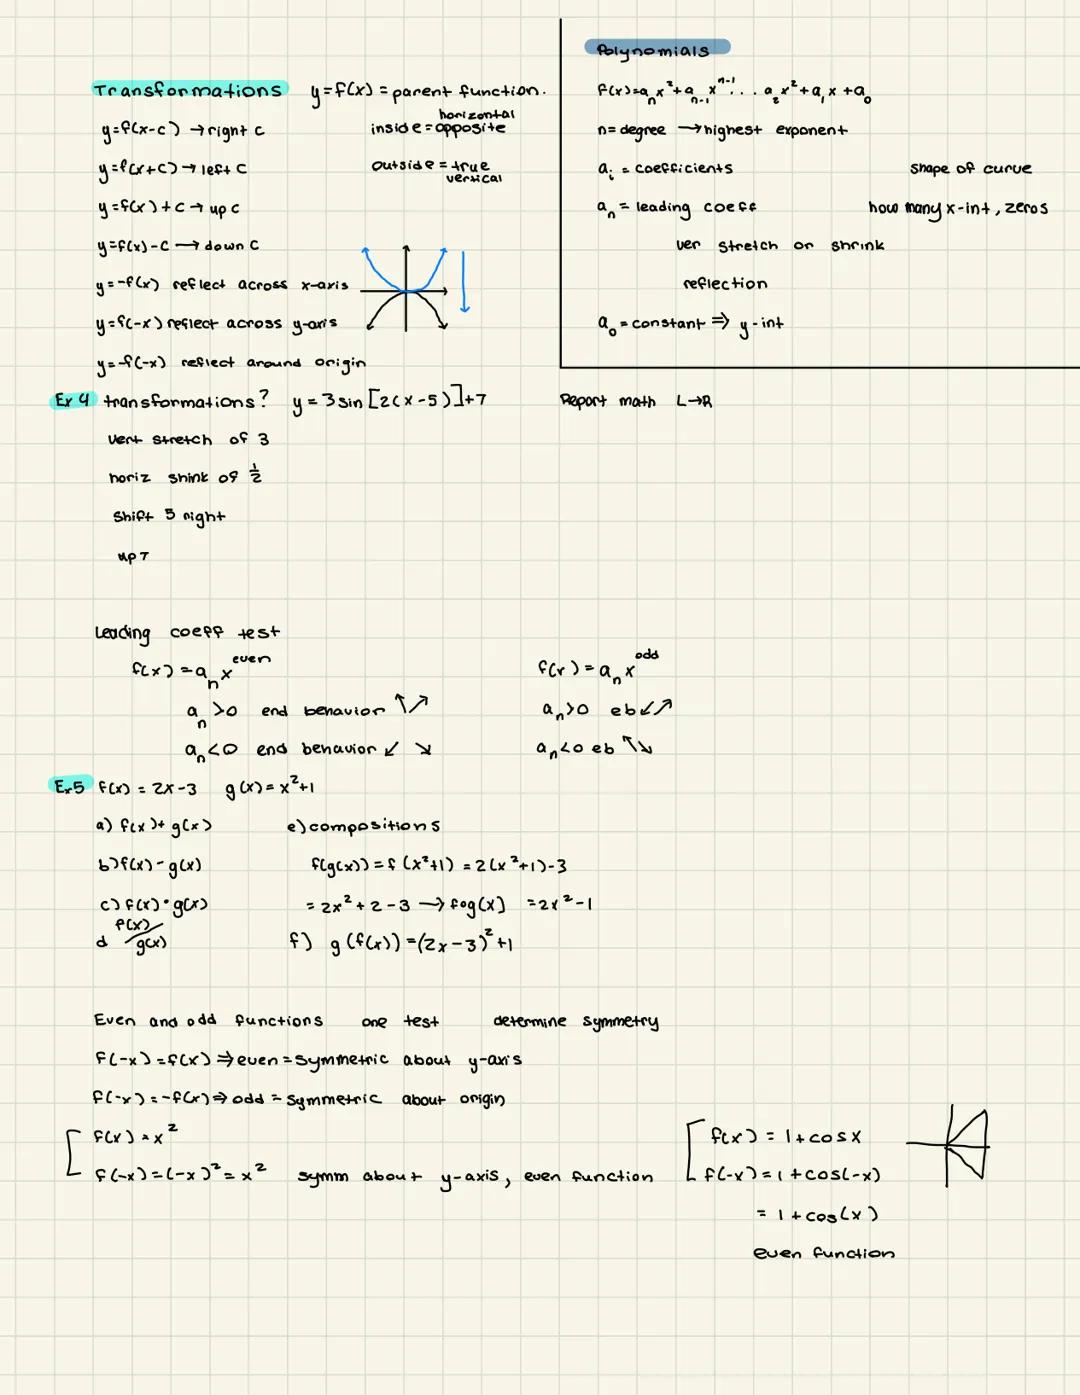
Working with Limits
Evaluating limits often requires algebraic manipulation to overcome indeterminate forms. Let's see this in practice:
Consider the limit:
lim(x→3) (x²-9)/(x-3)
Direct substitution would give 0/0, which is indeterminate. However, we can factor the numerator:
lim(x→3) (x²-9)/(x-3) = lim(x→3) ((x+3)(x-3))/(x-3) = lim(x→3) (x+3) = 6
Similarly, for the expression /, we can factor the numerator x+1$$x-1/, which simplifies to x+1.
It's important to understand that limits don't always exist. Some functions grow without bound or oscillate indefinitely as they approach certain values.
A key connection between limits and continuity: if a function is continuous at a point, the limit as x approaches that point equals the function's value at that point. This relationship forms the foundation for many calculus concepts.
When evaluating limits, try these strategies:
- Direct substitution (when possible)
- Factoring to eliminate common terms
- Algebraic manipulation
- Using known limit properties
💡 Remember that a limit describes the behavior of a function near a point, not necessarily at the point itself.
7
of 10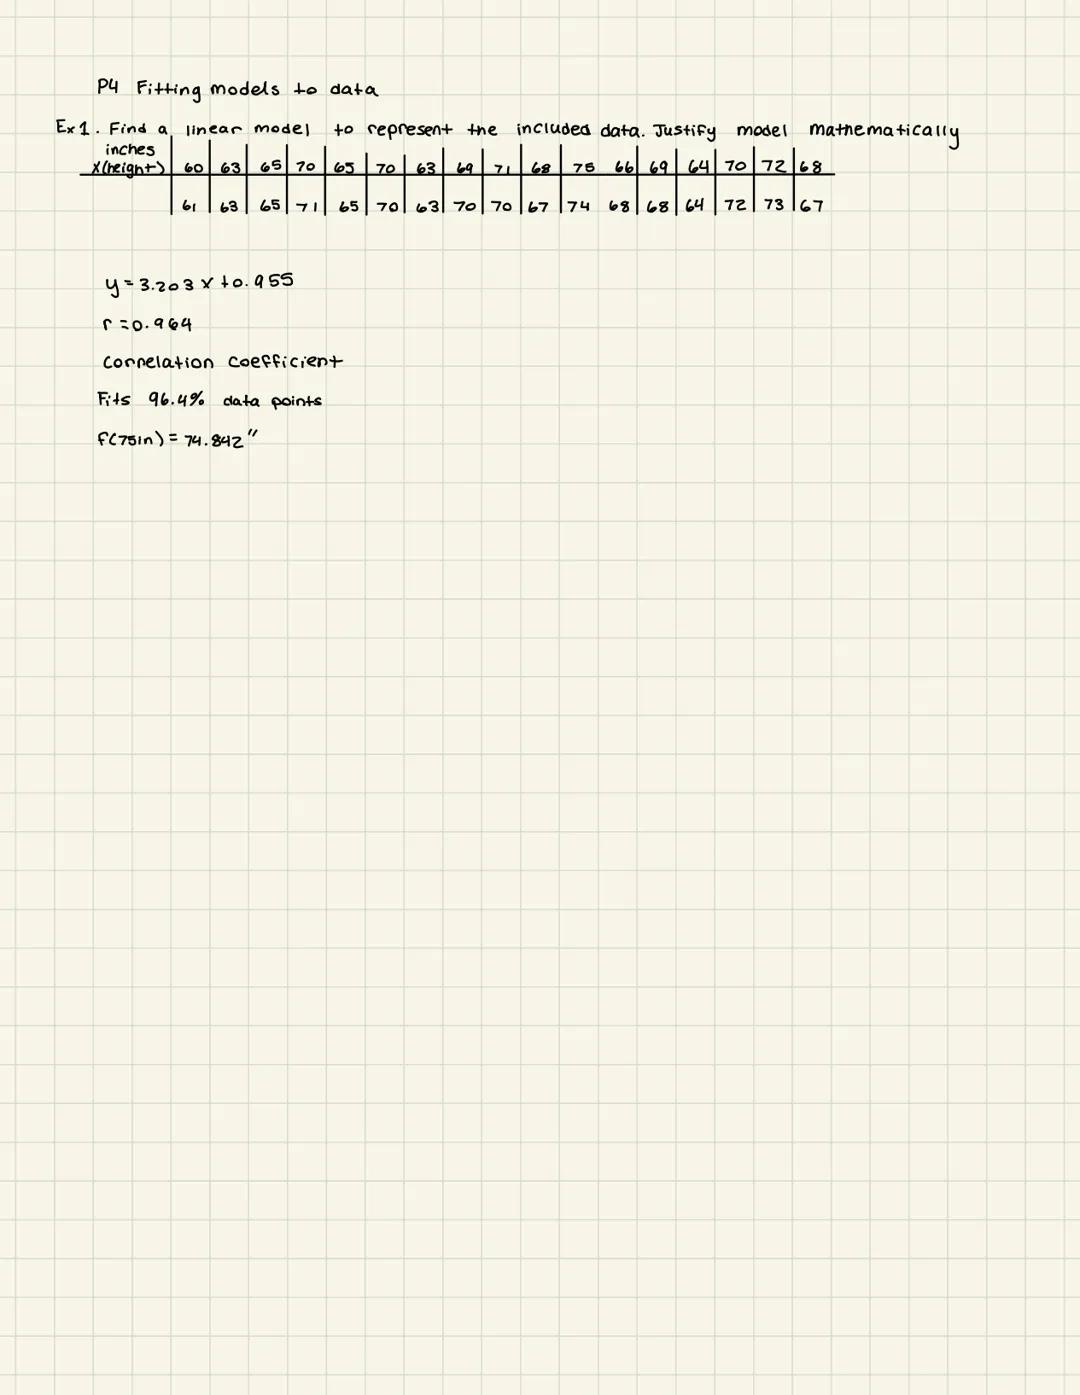
Evaluating Complex Limits
When examining the limit:
lim(x→0) (-x² + 3x)/x - (x² + 3x)/0
We need to be careful with our approach. The second term involves division by zero, which is undefined.
This example highlights a common error in limit evaluation. We should approach the problem differently, likely by simplifying the first term and recognizing that the second term is problematic.
When dealing with limits, it's essential to:
- Identify whether direct substitution will lead to an indeterminate form
- Apply appropriate algebraic techniques to resolve indeterminate forms
- Remember that division by zero is undefined, not an indeterminate form
- Check your work by verifying that your simplifications are valid
Incorrect approaches to limits can lead to contradictions or nonsensical results. Always review your steps carefully and consider whether your answer makes sense in the context of the function's behavior.
Remember: Math should be logical and consistent. If your approach leads to a contradiction or undefined operation, revisit your method and try a different strategy.
8
of 10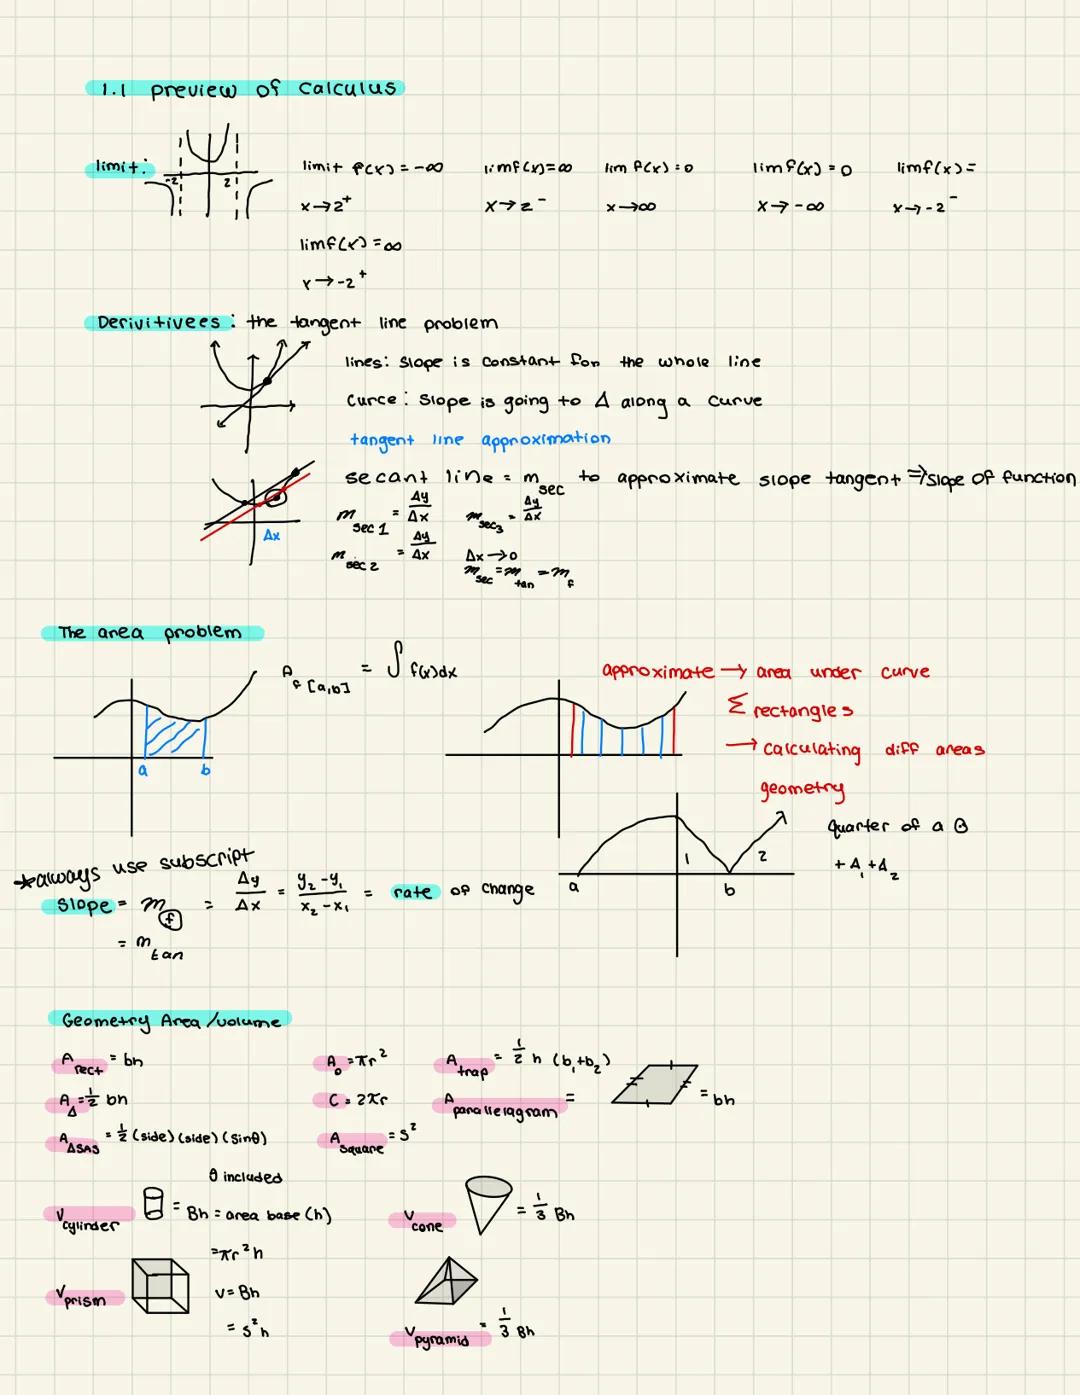
Analytical Limits
When evaluating limits, we need various techniques based on the function's form. Let's explore some key strategies:
For rational functions with indeterminate forms, factoring is often the solution. For example:
lim(x→-3) (x²+x-6)/(x+3) = lim(x→-3) ((x+3)(x-2))/(x+3) = -5
For more complex forms like √-1/x, we can multiply by the conjugate:
lim(x→0) (√(x+1)-1)/x × (√(x+1)+1)/(√(x+1)+1) = lim(x→0) ((x+1)-1)/(x(√(x+1)+1)) = 1/2
The squeeze theorem is another powerful tool: if h ≤ f ≤ g and lim(x→c) h = L = lim(x→c) g, then lim(x→c) f = L.
Two essential limits to memorize:
- lim(x→0) (sin x)/x = 1
- lim(x→0) /x = 0
These special limits help us solve more complex trigonometric limits:
lim(x→0) (tan x)/x = lim(x→0) ((sin x)/(cos x))(1/x) = 1
lim(x→0) (sin 4x)/x = 4
📝 When dealing with trigonometric limits, try breaking down complex expressions into basic forms where you can apply the special limit formulas.
9
of 10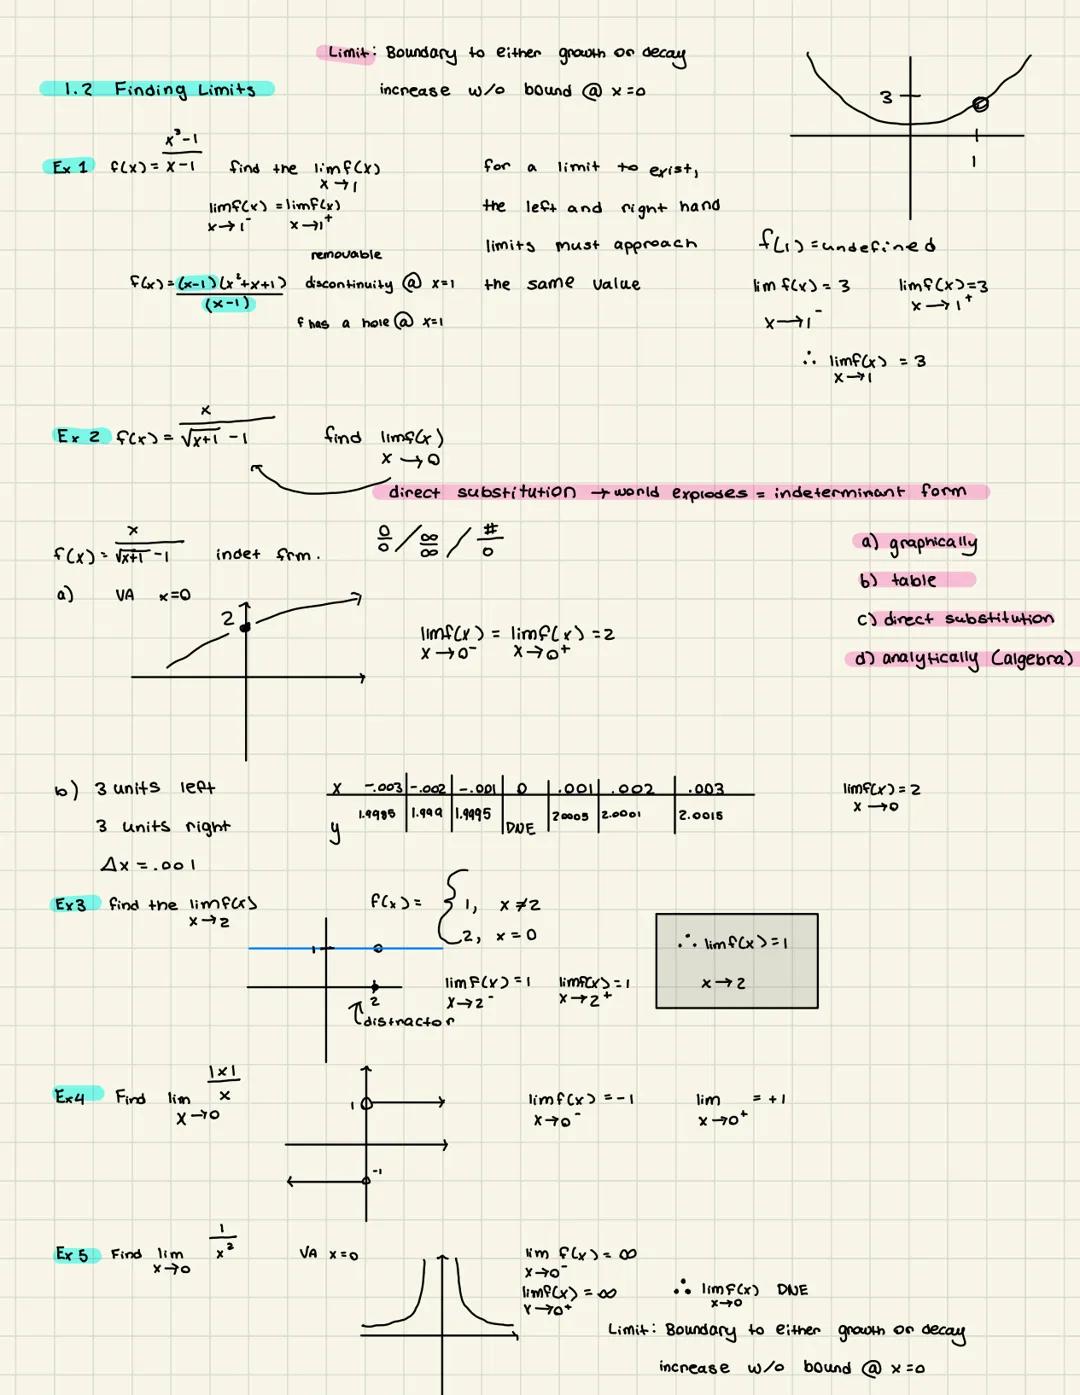
Continuity
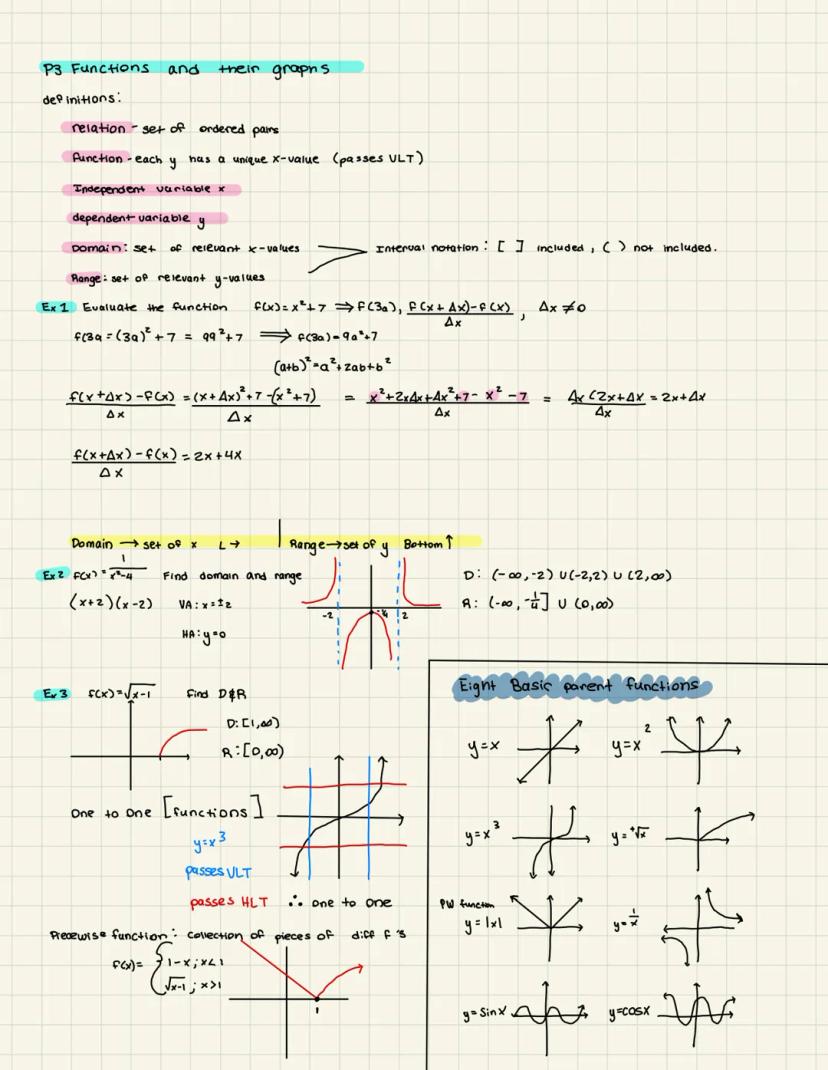
Continuity describes functions with no breaks, holes, or jumps in their graphs. Understanding continuity is crucial for applying many calculus techniques.
A function is continuous at a point c if all three conditions are met:
- f is defined
- lim(x→c) f exists
- lim(x→c) f = f
Discontinuities come in two main types:
- Removable discontinuities: Create "holes" in the graph, often from factors that can be canceled
- Non-removable discontinuities: Create vertical asymptotes or jumps that cannot be "fixed"
For example, the function g = / has a removable discontinuity (hole) at x = 1 because it simplifies to x+1 for all x ≠ 1.
When analyzing piecewise functions, check the behavior at transition points. For example:
f(x) = { x+1    if x ≤ 0
       { x²+1   if x > 0
At x = 0, both pieces give f(0) = 1, making the function continuous at this transition point.
For functions defined on closed intervals [a,b], we also need to check the endpoints with one-sided limits:
- At x = a: check that lim(x→a⁺) f = f
- At x = b: check that lim(x→b⁻) f = f
🔍 When analyzing continuity, drawing a quick sketch of the function can help you visualize potential discontinuities.
10
of 10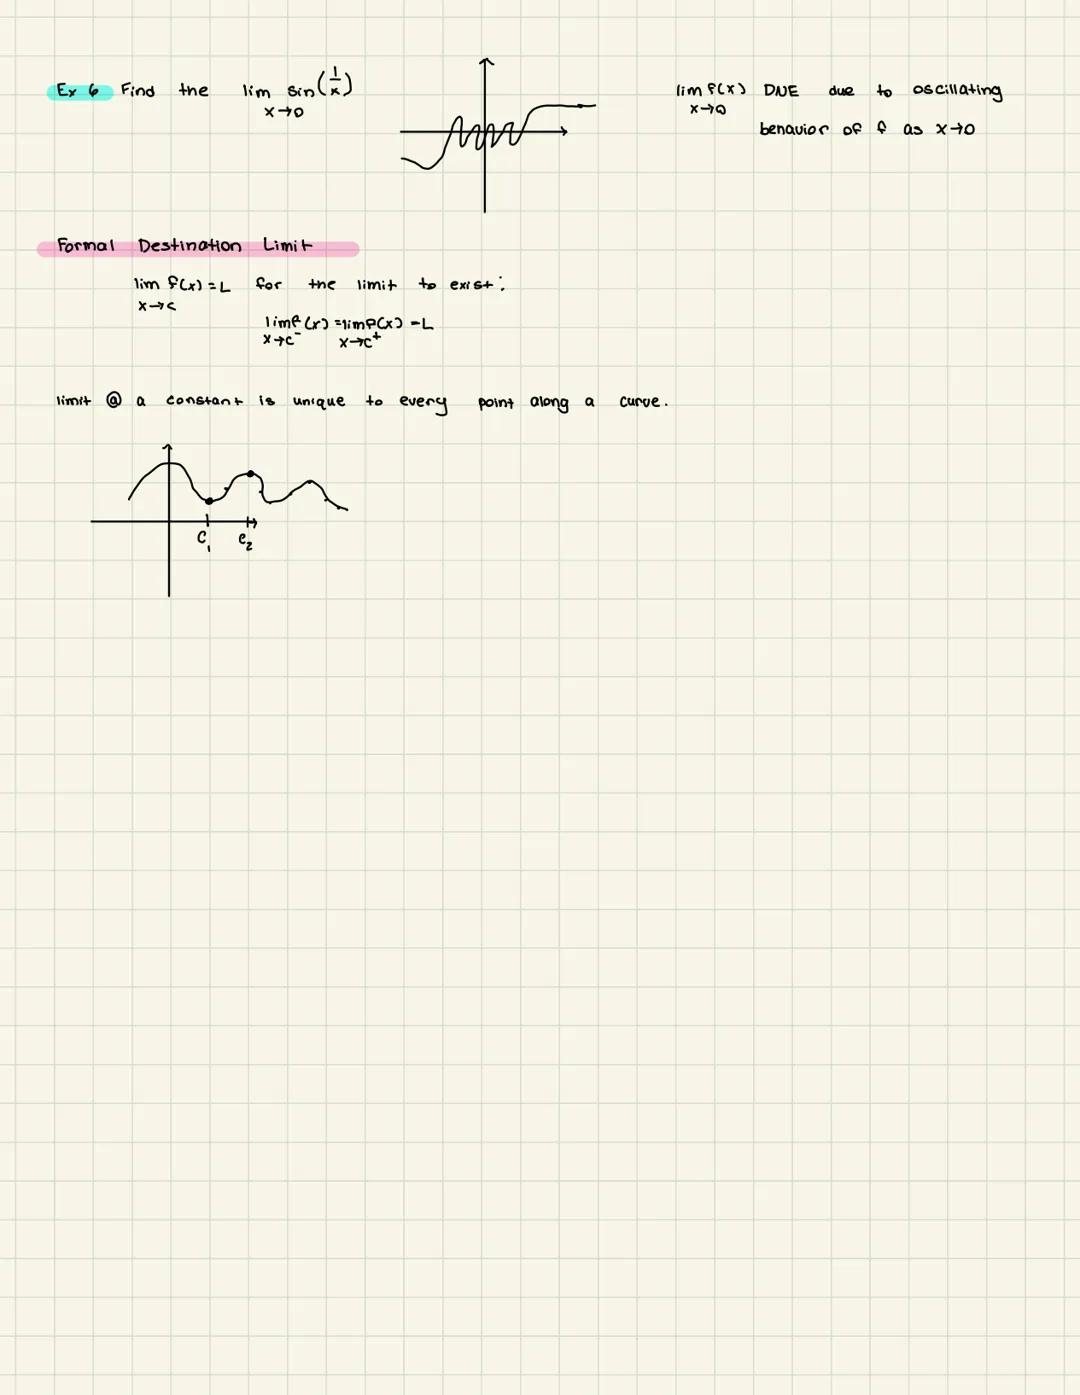
Analyzing Function Continuity
Determining whether a function is continuous requires checking both the function's behavior at specific points and across its entire domain.
For example, with f = √, the domain is . At the endpoints, we find:
lim(x→1⁻) f(x) = 0
lim(x→-1⁺) f(x) = 0
f(1) = 0
f(-1) = 0
Since these values match, and the function has no breaks within its domain, f is continuous over .
When working with rational functions, identifying discontinuities is crucial. Consider:
φ(x) = (x-6)/(x²-36) = (x-6)/((x+6)(x-6))
Simplifying (for x ≠ 6), we get:
f(x) = 1/(x+6)
This function has:
- A removable discontinuity (hole) at x = 6 (where the original numerator and denominator both equal zero)
- A vertical asymptote at x = -6 (non-removable discontinuity)
To classify discontinuities:
- Removable: Function can be redefined to be continuous (typically holes from canceled factors)
- Non-removable: Cannot be fixed by redefining the function at a single point (usually vertical asymptotes or jumps)
Understanding these concepts allows you to analyze complex functions and determine where they behave continuously, which is essential for applying calculus techniques correctly.
We thought you’d never ask...
Our AI companion is specifically built for the needs of students. Based on the millions of content pieces we have on the platform we can provide truly meaningful and relevant answers to students. But its not only about answers, the companion is even more about guiding students through their daily learning challenges, with personalised study plans, quizzes or content pieces in the chat and 100% personalisation based on the students skills and developments.
You can download the app in the Google Play Store and in the Apple App Store.
That's right! Enjoy free access to study content, connect with fellow students, and get instant help – all at your fingertips.
Similar Content
Most popular content: Limit
1Most popular content in AP Calculus AB/BC
5Derivative and Integral Review
Concise review for derivatives and integrals in calculus. Includes derivative rules (+ examples) and basic strategies for taking integrals in the first level of calculus (+ examples).
703
Calculus Essentials
all formulas to memorize for AP Calculus AB exam
19214
AP Calculus AB Answer Key
Answer Key
2762
AP CALC AB: Limits and Continuity
Limits and continuity - CALC AB
1835
Integration by Parts
how to do integration by parts for calculus bc
12th280
Most popular content
9O
Origins and Dynamics of the Columbian Exchange
Analyze the ecological and economic motivations behind the initial transfer of goods, people, and diseases between the Old and New Worlds.
9th3,1280
I
Introduction to Early Cultural Interactions
Analyze the initial social and religious encounters between Europeans, Africans, and Indigenous peoples in the colonial Americas.
9th2,7730
O
Origins of Ancient River Civilizations
Analyze the environmental factors and technological innovations that led to the rise of early states in Mesopotamia, Egypt, and the Indus Valley.
9th3,1870
M
Motivations for European Exploration
Analyze the economic, religious, and political factors that drove European powers to the Americas during the 15th and 16th centuries.
9th1,7780
F
Foundations of Ethical Guidelines in Research
Practice the core principles of the APA ethical code including informed consent, debriefing, and the role of Institutional Review Boards.
9th1,3360
I
Introduction to Native American Societies
Examine the diverse social, political, and economic structures of North American indigenous groups prior to European contact.
9th1,1100
I
Introduction to the Spanish Encomienda System
Explore the fundamental economic and social structures of the Spanish colonial system, focusing on the encomienda and the casta social hierarchy.
9th8890
I
Introduction to Biological Elements of Life
Practice identifying the essential elements including carbon, nitrogen, phosphorus, and sulfur that compose biological macromolecules.
9th1,7410
O
Origins of the Articles of Confederation
Practice identifying the motivations for a weak central government and the specific powers granted to the states under the first U.S. constitution.
9th9370
Students love us — and so will you.
4.6/5App Store
4.7/5Google Play
The app is very easy to use and well designed. I have found everything I was looking for so far and have been able to learn a lot from the presentations! I will definitely use the app for a class assignment! And of course it also helps a lot as an inspiration.
Stefan SiOS user
This app is really great. There are so many study notes and help [...]. My problem subject is French, for example, and the app has so many options for help. Thanks to this app, I have improved my French. I would recommend it to anyone.
Samantha KlichAndroid user
Wow, I am really amazed. I just tried the app because I've seen it advertised many times and was absolutely stunned. This app is THE HELP you want for school and above all, it offers so many things, such as workouts and fact sheets, which have been VERY helpful to me personally.
AnnaiOS user
Complete AP Calculus AB Notebook
Lauren Smith@laurentrees
Calculus is the mathematical study of continuous change, essential for understanding physics, engineering, and many scientific problems. This branch of mathematics introduces powerful tools for analyzing rates of change, finding areas under curves, and solving complex optimization problems through derivatives...
1
of 10
Sign up to see the content. It's free!
- Access to all documents
- Improve your grades
- Join milions of students
Systems of Equations
Finding the solution to systems of equations requires identifying where two or more equations intersect. Let's break down the analytical approach!
When solving a system with one linear and one quadratic equation, we can use substitution to find points of intersection. In this method, you isolate a variable from the linear equation and substitute it into the quadratic equation.
For example, if we have the system:
x² - y = 3
x - y = 1
We can rewrite the second equation as y = x - 1, then substitute this into the first equation:
x² - (x - 1) = 3
x² - x + 1 = 3
x² - x - 2 = 0
(x - 2)(x + 1) = 0
This gives us x = 2 or x = -1, which we can plug back into y = x - 1 to find the complete solutions: (2, 1) and .
💡 When solving systems with quadratic equations, always check all solutions by substituting back into both original equations, as some may be extraneous!
2
of 10Sign up to see the content. It's free!
- Access to all documents
- Improve your grades
- Join milions of students
Solving Systems Analytically
Solving systems of equations by hand requires careful algebraic manipulation. Let's explore a complete example:
For the system:
x² - y = 3
x - y = 1
First, we need to isolate a variable from one equation. From the second equation:
x - y = 1
y = x - 1
Now substitute this expression for y into the first equation:
x² - (x - 1) = 3
x² - x + 1 = 3
x² - x - 2 = 0
(x - 2)(x + 1) = 0
This gives us x = 2 or x = -1.
Substituting back:
- When x = 2: y = 2 - 1 = 1, giving solution (2, 1)
- When x = -1: y = -1 - 1 = -2, giving solution
When working with real-world data, we often use regression analysis to find mathematical models. For example, in the cell phone subscriber data from 1990 to 2005, the quadratic regression model y = 0.077x² + 2.09x + 4.143 fits with 99.9% accuracy .
Using this model, we can predict that by 2015 , there would be approximately 537.556 million cell phone subscribers.
3
of 10Sign up to see the content. It's free!
- Access to all documents
- Improve your grades
- Join milions of students
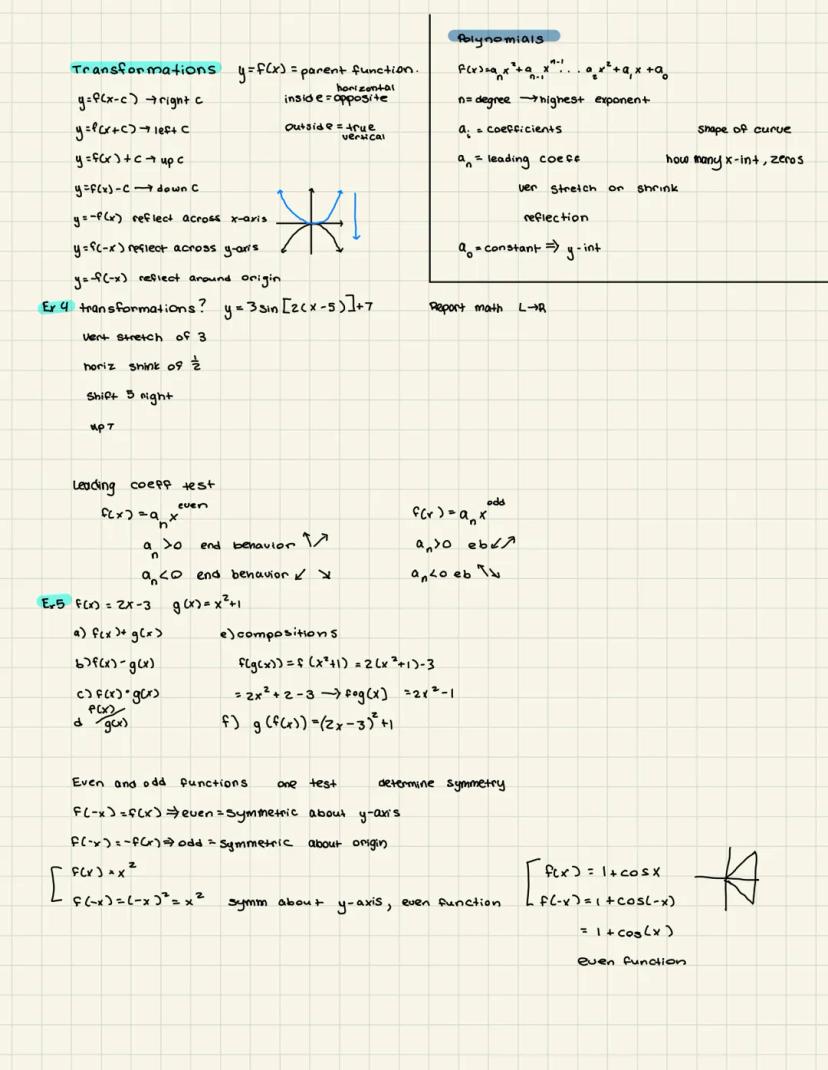
Linear Models and Rate of Change
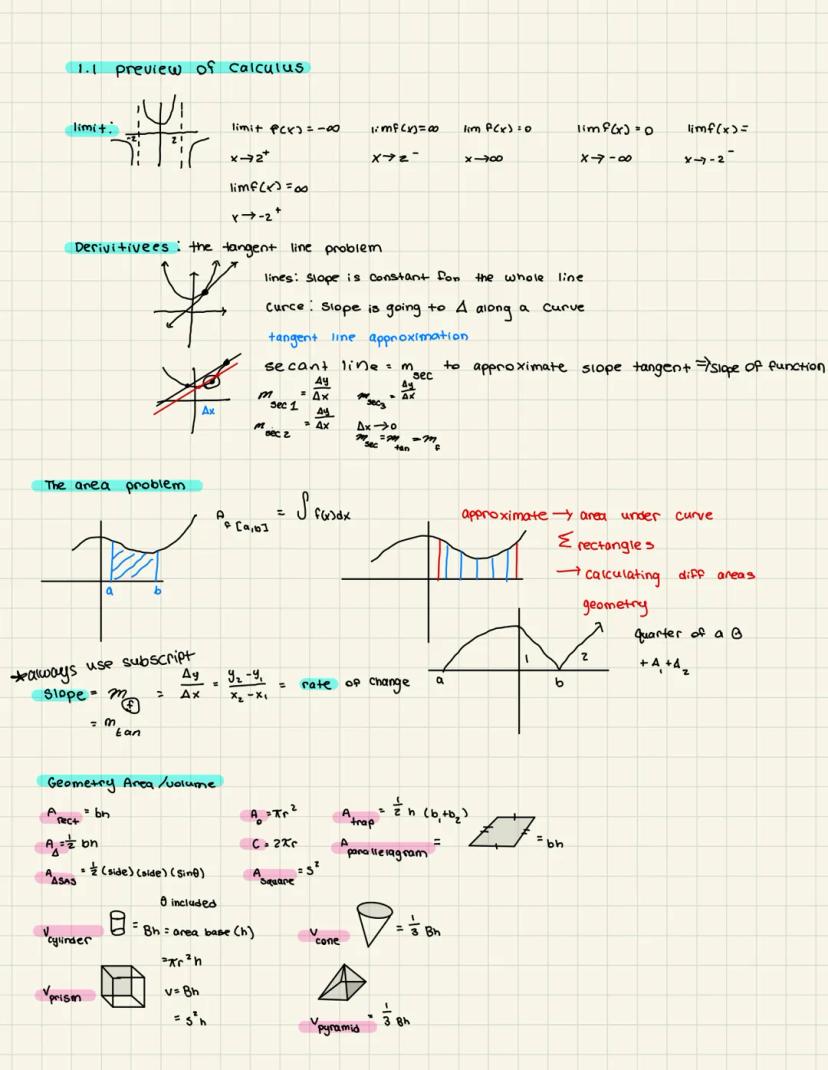
The rate of change between two points is calculated as the ratio of vertical change to horizontal change. This fundamental concept gives us the slope of a line!
Rate of change formula:
ROC = Δy/Δx = (y₂ - y₁)/(x₂ - x₁)
This ratio tells us how much y changes for each unit change in x. For example, if a car travels 120 miles in 2 hours, its rate of change (speed) is 60 miles per hour.
When working with lines, remember these key relationships:
- Parallel lines: have the same slope
- Perpendicular lines: have slopes that are negative reciprocals
- Vertical lines: have undefined slope
- Horizontal lines: have slope = 0
The point-slope formula is a powerful way to write an equation: y - y₁ = m
For example, to write the equation of a line with slope 3 passing through (1,2):
y - 2 = 3(x - 1)
y = 3x - 1
When analyzing real data, like Colorado's population growth from 3,829,000 in 1995 to 4,665,000 in 2005, we can calculate the average rate of change:
AROC = (4,665,000 - 3,827,000)/10 = 83,800 people/year
🔑 The units of slope always reflect the relationship between the quantities—like people/year, meters/second, or dollars/hour.
4
of 10Sign up to see the content. It's free!
- Access to all documents
- Improve your grades
- Join milions of students
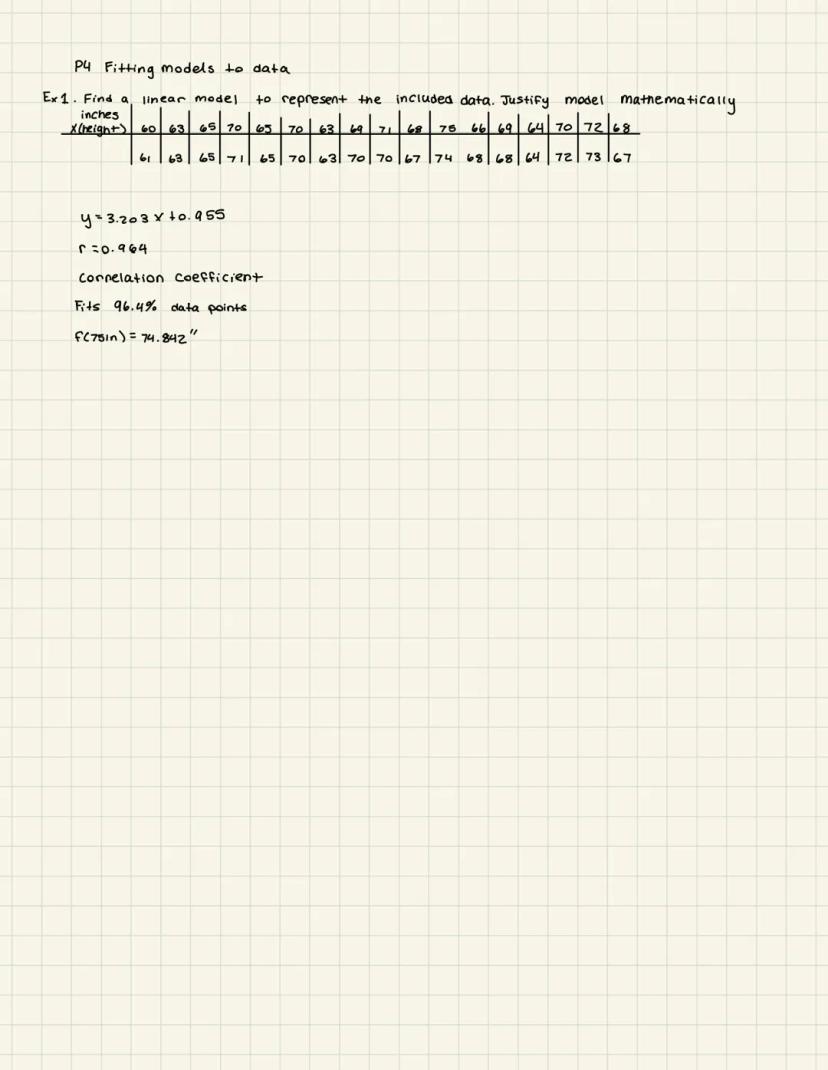
Fitting Models to Data
Data modeling allows us to make predictions and understand relationships between variables. Linear models are among the simplest and most widely used.
When fitting a linear model to data, we look for an equation in the form y = mx + b that best represents the relationship between variables. The process involves calculating the slope and y-intercept that minimize the difference between predicted and actual values.
For data points like height measurements corresponding to different lengths, we can use statistical techniques to find the best-fitting line. The result might look like:
y = 3.203x + 0.955
The correlation coefficient measures how well the model fits the data. In our example, r = 0.964, meaning the model fits 96.4% of the data points—a very strong correlation.
Once we have our model, we can make predictions. For instance, for a length of 75 inches, our model predicts a height of 74.842 inches.
This modeling approach is incredibly useful in fields ranging from economics to engineering, allowing us to understand patterns and make informed decisions based on data.
Remember that while linear models are useful for many relationships, not all data follows a straight line. Sometimes we need quadratic, exponential, or other types of models for accurate representation.
5
of 10Sign up to see the content. It's free!
- Access to all documents
- Improve your grades
- Join milions of students
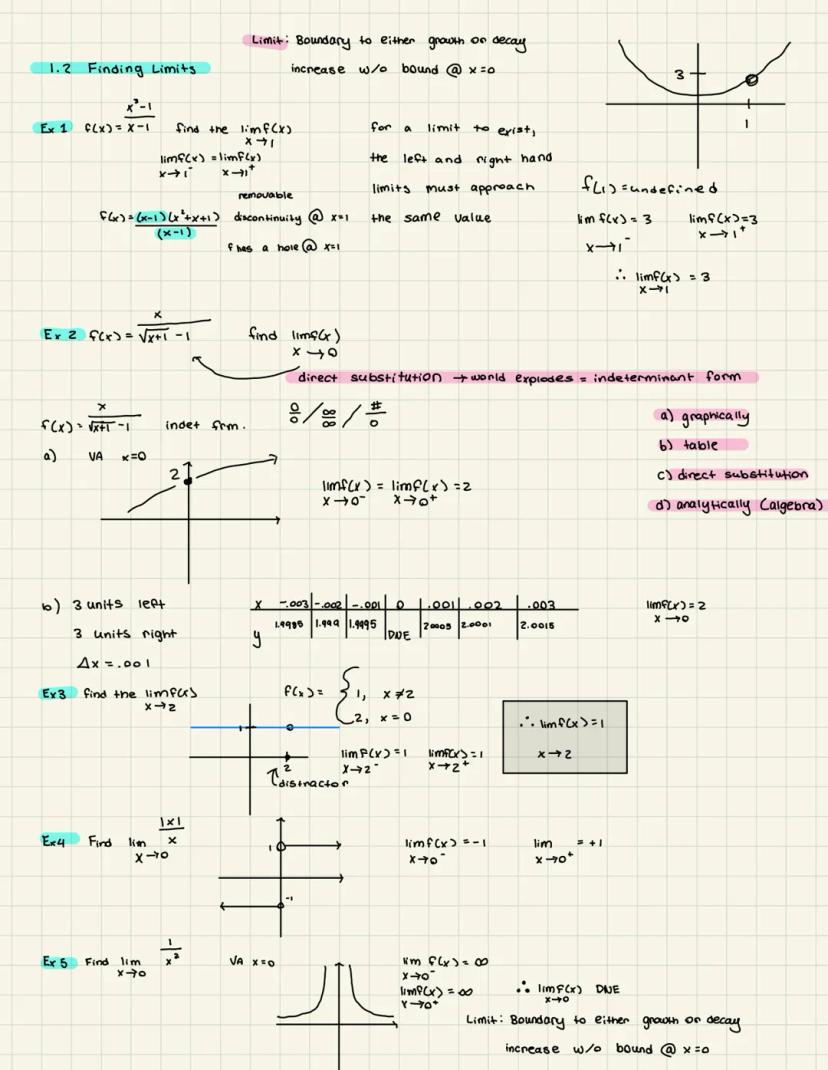
Limits
Limits are fundamental to calculus and describe the behavior of a function as its input approaches a specific value.
The notation lim(x→0) sin asks: "What value does sin approach as x gets closer and closer to 0?"
In this example, as x approaches 0, the function sin oscillates rapidly between -1 and 1, never settling on a single value. Therefore, this limit does not exist (DNE) due to the oscillating behavior.
For a limit to exist at a point c, the left-hand limit (approaching from values less than c) must equal the right-hand limit (approaching from values greater than c):
lim(x→c⁻) f(x) = lim(x→c⁺) f(x) = L
Each point along a curve has its own unique limit value, representing the behavior of the function near that point. This concept is essential for defining derivatives and understanding function behavior.
When evaluating limits, we examine what happens as we get arbitrarily close to the point of interest, without actually reaching it. This allows us to understand the behavior of functions even at points where they might not be defined.
6
of 10Sign up to see the content. It's free!
- Access to all documents
- Improve your grades
- Join milions of students
Working with Limits
Evaluating limits often requires algebraic manipulation to overcome indeterminate forms. Let's see this in practice:
Consider the limit:
lim(x→3) (x²-9)/(x-3)
Direct substitution would give 0/0, which is indeterminate. However, we can factor the numerator:
lim(x→3) (x²-9)/(x-3) = lim(x→3) ((x+3)(x-3))/(x-3) = lim(x→3) (x+3) = 6
Similarly, for the expression /, we can factor the numerator x+1$$x-1/, which simplifies to x+1.
It's important to understand that limits don't always exist. Some functions grow without bound or oscillate indefinitely as they approach certain values.
A key connection between limits and continuity: if a function is continuous at a point, the limit as x approaches that point equals the function's value at that point. This relationship forms the foundation for many calculus concepts.
When evaluating limits, try these strategies:
- Direct substitution (when possible)
- Factoring to eliminate common terms
- Algebraic manipulation
- Using known limit properties
💡 Remember that a limit describes the behavior of a function near a point, not necessarily at the point itself.
7
of 10Sign up to see the content. It's free!
- Access to all documents
- Improve your grades
- Join milions of students
Evaluating Complex Limits
When examining the limit:
lim(x→0) (-x² + 3x)/x - (x² + 3x)/0
We need to be careful with our approach. The second term involves division by zero, which is undefined.
This example highlights a common error in limit evaluation. We should approach the problem differently, likely by simplifying the first term and recognizing that the second term is problematic.
When dealing with limits, it's essential to:
- Identify whether direct substitution will lead to an indeterminate form
- Apply appropriate algebraic techniques to resolve indeterminate forms
- Remember that division by zero is undefined, not an indeterminate form
- Check your work by verifying that your simplifications are valid
Incorrect approaches to limits can lead to contradictions or nonsensical results. Always review your steps carefully and consider whether your answer makes sense in the context of the function's behavior.
Remember: Math should be logical and consistent. If your approach leads to a contradiction or undefined operation, revisit your method and try a different strategy.
8
of 10Sign up to see the content. It's free!
- Access to all documents
- Improve your grades
- Join milions of students
Analytical Limits
When evaluating limits, we need various techniques based on the function's form. Let's explore some key strategies:
For rational functions with indeterminate forms, factoring is often the solution. For example:
lim(x→-3) (x²+x-6)/(x+3) = lim(x→-3) ((x+3)(x-2))/(x+3) = -5
For more complex forms like √-1/x, we can multiply by the conjugate:
lim(x→0) (√(x+1)-1)/x × (√(x+1)+1)/(√(x+1)+1) = lim(x→0) ((x+1)-1)/(x(√(x+1)+1)) = 1/2
The squeeze theorem is another powerful tool: if h ≤ f ≤ g and lim(x→c) h = L = lim(x→c) g, then lim(x→c) f = L.
Two essential limits to memorize:
- lim(x→0) (sin x)/x = 1
- lim(x→0) /x = 0
These special limits help us solve more complex trigonometric limits:
lim(x→0) (tan x)/x = lim(x→0) ((sin x)/(cos x))(1/x) = 1
lim(x→0) (sin 4x)/x = 4
📝 When dealing with trigonometric limits, try breaking down complex expressions into basic forms where you can apply the special limit formulas.
9
of 10Sign up to see the content. It's free!
- Access to all documents
- Improve your grades
- Join milions of students
Continuity
Continuity describes functions with no breaks, holes, or jumps in their graphs. Understanding continuity is crucial for applying many calculus techniques.
A function is continuous at a point c if all three conditions are met:
- f is defined
- lim(x→c) f exists
- lim(x→c) f = f
Discontinuities come in two main types:
- Removable discontinuities: Create "holes" in the graph, often from factors that can be canceled
- Non-removable discontinuities: Create vertical asymptotes or jumps that cannot be "fixed"
For example, the function g = / has a removable discontinuity (hole) at x = 1 because it simplifies to x+1 for all x ≠ 1.
When analyzing piecewise functions, check the behavior at transition points. For example:
f(x) = { x+1    if x ≤ 0
       { x²+1   if x > 0
At x = 0, both pieces give f(0) = 1, making the function continuous at this transition point.
For functions defined on closed intervals [a,b], we also need to check the endpoints with one-sided limits:
- At x = a: check that lim(x→a⁺) f = f
- At x = b: check that lim(x→b⁻) f = f
🔍 When analyzing continuity, drawing a quick sketch of the function can help you visualize potential discontinuities.
10
of 10Sign up to see the content. It's free!
- Access to all documents
- Improve your grades
- Join milions of students
Analyzing Function Continuity
Determining whether a function is continuous requires checking both the function's behavior at specific points and across its entire domain.
For example, with f = √, the domain is . At the endpoints, we find:
lim(x→1⁻) f(x) = 0
lim(x→-1⁺) f(x) = 0
f(1) = 0
f(-1) = 0
Since these values match, and the function has no breaks within its domain, f is continuous over .
When working with rational functions, identifying discontinuities is crucial. Consider:
φ(x) = (x-6)/(x²-36) = (x-6)/((x+6)(x-6))
Simplifying (for x ≠ 6), we get:
f(x) = 1/(x+6)
This function has:
- A removable discontinuity (hole) at x = 6 (where the original numerator and denominator both equal zero)
- A vertical asymptote at x = -6 (non-removable discontinuity)
To classify discontinuities:
- Removable: Function can be redefined to be continuous (typically holes from canceled factors)
- Non-removable: Cannot be fixed by redefining the function at a single point (usually vertical asymptotes or jumps)
Understanding these concepts allows you to analyze complex functions and determine where they behave continuously, which is essential for applying calculus techniques correctly.
We thought you’d never ask...
Our AI companion is specifically built for the needs of students. Based on the millions of content pieces we have on the platform we can provide truly meaningful and relevant answers to students. But its not only about answers, the companion is even more about guiding students through their daily learning challenges, with personalised study plans, quizzes or content pieces in the chat and 100% personalisation based on the students skills and developments.
You can download the app in the Google Play Store and in the Apple App Store.
That's right! Enjoy free access to study content, connect with fellow students, and get instant help – all at your fingertips.
Similar Content
Most popular content: Limit
1Most popular content in AP Calculus AB/BC
5Derivative and Integral Review
Concise review for derivatives and integrals in calculus. Includes derivative rules (+ examples) and basic strategies for taking integrals in the first level of calculus (+ examples).
703
Calculus Essentials
all formulas to memorize for AP Calculus AB exam
19214
AP Calculus AB Answer Key
Answer Key
2762
AP CALC AB: Limits and Continuity
Limits and continuity - CALC AB
1835
Integration by Parts
how to do integration by parts for calculus bc
12th280
Most popular content
9O
Origins and Dynamics of the Columbian Exchange
Analyze the ecological and economic motivations behind the initial transfer of goods, people, and diseases between the Old and New Worlds.
9th3,1280
I
Introduction to Early Cultural Interactions
Analyze the initial social and religious encounters between Europeans, Africans, and Indigenous peoples in the colonial Americas.
9th2,7730
O
Origins of Ancient River Civilizations
Analyze the environmental factors and technological innovations that led to the rise of early states in Mesopotamia, Egypt, and the Indus Valley.
9th3,1870
M
Motivations for European Exploration
Analyze the economic, religious, and political factors that drove European powers to the Americas during the 15th and 16th centuries.
9th1,7780
F
Foundations of Ethical Guidelines in Research
Practice the core principles of the APA ethical code including informed consent, debriefing, and the role of Institutional Review Boards.
9th1,3360
I
Introduction to Native American Societies
Examine the diverse social, political, and economic structures of North American indigenous groups prior to European contact.
9th1,1100
I
Introduction to the Spanish Encomienda System
Explore the fundamental economic and social structures of the Spanish colonial system, focusing on the encomienda and the casta social hierarchy.
9th8890
I
Introduction to Biological Elements of Life
Practice identifying the essential elements including carbon, nitrogen, phosphorus, and sulfur that compose biological macromolecules.
9th1,7410
O
Origins of the Articles of Confederation
Practice identifying the motivations for a weak central government and the specific powers granted to the states under the first U.S. constitution.
9th9370
Students love us — and so will you.
4.6/5App Store
4.7/5Google Play
The app is very easy to use and well designed. I have found everything I was looking for so far and have been able to learn a lot from the presentations! I will definitely use the app for a class assignment! And of course it also helps a lot as an inspiration.
Stefan SiOS user
This app is really great. There are so many study notes and help [...]. My problem subject is French, for example, and the app has so many options for help. Thanks to this app, I have improved my French. I would recommend it to anyone.
Samantha KlichAndroid user
Wow, I am really amazed. I just tried the app because I've seen it advertised many times and was absolutely stunned. This app is THE HELP you want for school and above all, it offers so many things, such as workouts and fact sheets, which have been VERY helpful to me personally.
AnnaiOS user